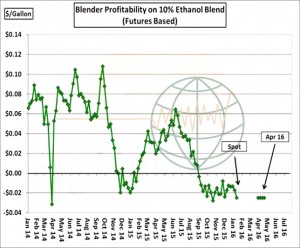
- The graphic below charts futures-based ethanol blending margins, which are deeply negative into spring. Despite ongoing near record ethanol production, domestic blend demand has been a bit weak, and ethanol stocks continue to build. Eventually (when?), production margins will reduce to slow the US ethanol grind and, overall, ongoing weakness in energy markets will continue to weigh on major commodity indexes. For now the US corn balance sheet cannot afford to lose domestic use.
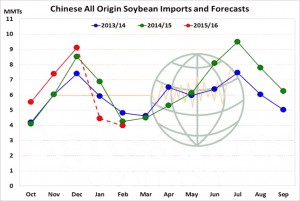
- As of yesterday, Chinese Customs data showed December soybean imports of 9.1 million mt, a five month high and record large for December. Based on US/S American shipments, we estimate Jan imports of 4.4 million mt and Feb imports at 4 million. Despite slower imports in Jan-Feb, the pace of imports is still on track to hit the USDA annual forecast of 80.5 million mt.
- The USDA reports this week were not bullish, but also did not offer any bearish surprises. Last week’s CFTC report showed funds with the largest net short position since June, and short covering appears to be the only supportive feature in the market. We continue to view price rallies as short lived and selling opportunities at this time, until such time as there is some fresh news with a bullish tone.
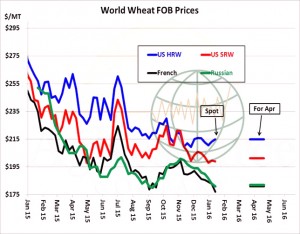
- As mentioned previously, world wheat cash markets were unmoved by the USDA’s US winter wheat seedings number, and Russian offers actually ended weaker despite the report. The graphic below illustrates the recent widening of US premium to other origins, and US exports will be the market’s central focus in the near term. French fob offers have reached a season cash low, perhaps illustrating the stagnant export demand and trade. Snow cover has expanded as projected across C and E Europe and the Black Sea, which should add some insulating protection in advance of the forecast lower temperatures.
- The USDA has today released its weekly export figures as detailed below:
Wheat: 290,600 mt, which is within estimates of 150,000-350,000 mt.
Corn: 669,300 mt, which is above estimates of 400,000-650,000 mt.
Soybeans: 1,127,400 mt, which is within estimates of 900,000-1,300,000 mt.
Soybean Meal: 64,700 mt, which is within estimates of 50,000-180,000 mt.
Soybean Oil: 41,200 mt, which is above estimates of 5,000-20,000 mt.
- Our comment on this week’s US exports is that whilst corn and soybean volumes were at the higher end of trade expectation they are not market moving, and the trade now seems to appreciate that despite a cut in the US winter wheat seeding area world cash prices have continued to drift lower and US Gulf premiums to both Russian and EU origins are unsustainable. Consequently we are seeing US futures levels easing back following Russian and French cash levels.
- Brussels has issued weekly wheat export certificates totalling 783,342 mt, which brings the season total to 14,762,856 mt. This is 900,626 mt (5.75%) behind last year.
- There has been a suggestion that Chinese grain stocks (wheat, rice and corn) are now upwards of 500 million mt compared with the USDA’s figure of 250 million. Consequently the prospect of a curtailment in shipments, potentially to a substantial level and in the very near future, looks to be very real.
- In conclusion, we remain of the view that ag markets require adverse weather, a significant boost in Chinese demand (preceded by economic stability – of course) and/or increased biofuel consumption in order to sustain any lasting rallies. At this time none of these are available and whilst we may see price hiccups or bounces along the way (as has been the case post USDA this week) it feels very much as if US export demand and overall global trade will remain the key price drivers for the time being.


