20 May 2015

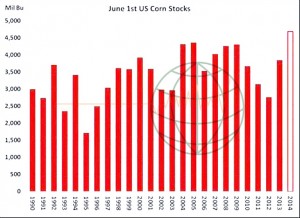
  • The June 1st US corn stocks are expected to be record large at just over 4.5 billion bu. The US farmer is supposedly sitting on a huge stock of unsold old crop corn. The problem is that US corn export demand is suffering amid keen export competition from Brazil and Argentina. Ukraine is offering corn well below the US in a new crop position. The result will be if/when US farmers decide to sell that cash basis and futures could fall away from them. It is important right now to understand that if you are betting on higher corn prices, it’s a bet on adverse Midwest weather after mid-June.

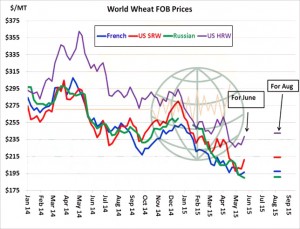
  • A surging US$ and the slowing of fund short covering sent US wheat futures to losses of 10-15 cents in yesterday’s trading. HRW conditions improved despite recent heavy rains in the S Plains, and world cash values are now far lower than US Gulf fob offers. Recent fund short covering is only further restricting potential 2015/16 US export demand. World cash fob offers into August are illustrated below. Weekly US export inspections totalled 11 million bu, down 2 million from the prior week. With cumulative shipments (799 million bu) down 38% from a year ago, the USDA still may be some 5-10 million bu too high with its 2014/15 export forecast. The EU and GFS weather models have also been consistent in forecasting a more lasting period of warm/dry weather across the S Plains beyond early next week, as the jet stream aligns itself more normally across the N Plains and Midwest. If realised, harvest will begin rather seamlessly in TX/OK in early June. CBOT open interest suggests the recent advance is indeed funds covering a portion of their massive short position. Russia’s crop size will determine seasonal lows in June/July. A close below $5.03 basis July ‘15 CBOT, foreshadows a test of recent lows. We’re willing sellers of any short covering advance to $5.30-5.40 with a dire Russian drought needed for a lasting trend change.

19 May 2015

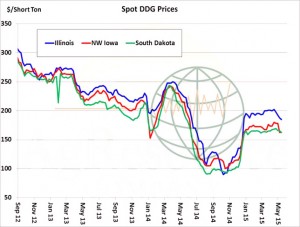
  • News that China has started to slow their imports of US DDGs due to their own oversupply of feed-grains and Government cajoling to halt/slow imports by state and private buyers is starting to pressure US prices. US DDG prices have turned down amid reduced export demand which is starting to allow it to compete more effectively with soymeal. We expect that China could import 150-200,000 mt per month, but this is well below the 500,000 mt plus of prior months.

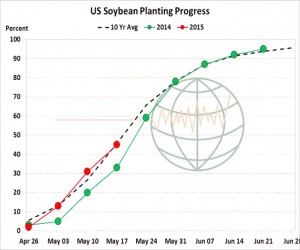
  • In the US the weather continues to lean bearish for soybeans as NASS reported planting progress through Sunday at 45% complete against 31% last year and the 10-year average of 37%. Active rainfall in the Western corn belt and to the North may keep planting slow this week but should pick up in the East. The above average pace of planting will provide a cushion for any weather delays, whilst the current wet conditions will likely add more soybean acres instead of corn in small areas of North Dakota and Minnesota.

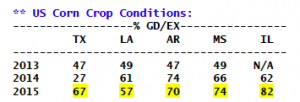
  • US corn seeding as of Sunday reached 85% complete, up 10% on the week and compared to the 10-year average of 78%. We expect planting to reach 94-96% in the next 7 days as fieldwork resumes across the Midwest and N Plains. Planting will continue across IL, IN, OH and KY this week, leaving only the C Plains lagging. Note also that conditions have been released from select states, which are displayed below. Conditions across the Delta/Southeast are steady with year-ago levels, while good/excellent conditions in TX and IL are well ahead of last year. Nationally, the crop is 56% emerged and US crop conditions will be released next Tuesday. We expect national good/excellent ratings in a range of 75-80%. Confirmation of high crop ratings next week should trigger a pre-pollination low of $3.50, basis July. Dec above $3.95 is a selling opportunity in our opinion, with a more dire weather threat needed to sustain a recovery above $4.00 Dec into mid to late June.

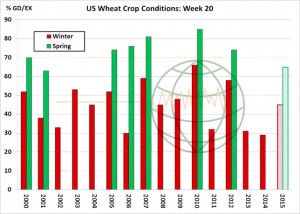
  • US winter wheat conditions were pegged at 45% good/excellent, vs. 44% last week and 29% a year ago and the 10-year average of 45%. Notable improvement was recorded across the PNW, KS and MI, with each up 2-4% points. Little change is noted elsewhere. Initial spring wheat ratings, which have been released much earlier than normal – rest at 65% good/excellent, a bit lower than expected. Warmer weather in late May will likely trigger an improvement. Another 1-4” of rain is scheduled for TX and OK in the next 6-7 days, after which a more lasting period of dryness develops. Quality will be a more serious issue if lingering precipitation continues in June, but it’s much too early to quantify quality losses, if any, just yet. It is worth noting that  as far as the US is concerned this is also a moot point without improved export demand.

  • Today has seen some pressure returning to CBOT prices as a stronger US$ and favourable weather forecasts for this week’s seeding cap recent gains. July ’15 soybeans have broken below $9.50/bu and July ’15 corn appears to be targeting $3.50/bu. Recent fund buying in July ’15 wheat appears to be slowing and we have seen a downward price correction, a close below $5.00/bu basis July ’15 futures would likely produce a test of the contract lows. We continue to doubt that seasonal lows have yet been seen.
  • Today saw the USA announce an old crop soybean sale to China (132,000 mt), which the trade does not expect to see shipped until a new crop position. Strategic Chinese purchasing to support old crop prices may well be a driver of the reported trade.
  • Interestingly, for us in Europe, despite another 200 point drop in the €uro, Matif wheat fell €2 mirroring Chicago. It would be logical to conclude therefore that Paris wheat is currently trading as a function of its transatlantic cousin rather than on its own merits.
  • As a final comment, US wheat quality issues will not be resolved until harvest, but it should not be forgotten that there is still no shortage of wheat in the world and despite a $25 rally in Chicago, Black Sea prices are up a more modest $5, and that is despite removal of the Russian export tariff!. In corn, US demand continues to be the issue, domestic (avian influenza) or exports (cheaper non-US supplies). DDG supplies do not assist the position either. With little in the way of weather risk (right now) and a potential increase in acres in the June USDA planting report, and the Brazilian crop coming to market in around ten weeks it seems that the bulls are struggling for a story right now. Nov ’15 soybeans broke and closed below last September’s contract lows, but the recent weather (slowdown of planting) and Argentine uncertainty held the market – until today. Last week’s USDA US end stock figures were all above “analysts” estimates, but this was shrugged off as the USDA is “always underestimating demand in May”! It may well be that we have to get to the June report, where it seems that there is a growing consensus that soybean acres could well grow by 2 million before we see the market really take a break on its next leg lower.

17 May 2015

Weekly CCI Analysis:

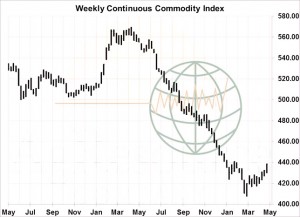
The CCI/CRB index closed higher for the 5th week on a row on rising energy, livestock and metal prices. The week ahead is important to gauge if the CCI can rise above the initial January highs? A close above this resistance would argue for further gains into early June. Fund managers have looked upon raw material prices as historically cheap – and they are based on price data since 2005. However, there is no evidence of any demand growth for energy, ags or metals. This means that oversupplied markets are likely to return at some juncture. The US$ has been in a corrective price phase since March and a turn higher in the greenback is expected during June. The US economy continues to find traction against a soft world economic outlook.
Longer-term soybean analysis:

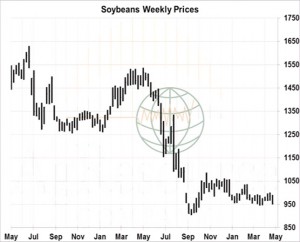
Soy futures fell sharply following the release of the May WASDE report and then traded quietly lower at the end of the week. July soybeans ended just above support at $9.50 (see weekly chart below). The USDA slightly increased their estimates for old crop soybean use into the end of the year, but the carryout projection remains at multi-year highs. Cash basis bids are holding at multi-year lows and the end user is adequately supplied. Processors are thought to be covered through mid-June. In new crop, US planting progress will have likely surpassed the 50% mark through Sunday and growing crops have been adequately watered in most regions of the country. The upcoming warming trend should jump emergence rates and initial crop ratings (expected in 2 weeks). China has been a very slow buyer of US new crop soybeans and is opting for Latin American soybeans instead. A drop under $9.50 basis July is expected to trigger another round of fund selling down to the September low, with good growing season weather to pull November under $8 by harvest.
Longer-term corn analysis:

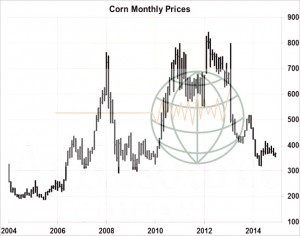
Corn futures ended up 2 cents this week, largely in sympathy of the US wheat market. The USDA’s new crop balance sheet was revealed mostly within expectations, but in our view its demand growth forecast is overstated, and with favourable US weather projected into July, 2015/16 stocks are likely to exceed 2,000 million bu. USDA’s new crop export forecast of 1,900 million bu is especially debatable, given that Ukraine is now offered corn at a steep discount to US Gulf origin into early 2016 and Brazil offers have returned from July forward. The May WASDE also featured a sizeable increase in Chinese feedgrain stocks. The market’s goal through the next 12 months is for the US to better compete with Black Sea and S American exporters for world trade, and to maintain profitable ethanol production and blend margins. Well above average initial US corn crop conditions are anticipated. Dec above $4.00 is a sale in our opinion with harvest lows expected at $3-3.30. End users are likely to support July below $3.50 pre pollination
Longer-term wheat analysis:

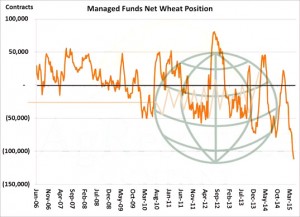
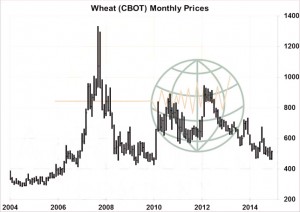
US wheat futures rallied 25-34 cents this week with KC pacing the advance. The trade has cited ongoing rainfall across the S Plains, dry 2-week forecasts across Siberia and uncertainty over Russia’s 2015/16 intervention price target, but in reality, funds were just too short. Non-commercial traders as of early this week held a record short position worth 115,000 contracts, and 25,000 were covered this week. We note that world cash markets end the week just 0-5% higher (vs. the 7% rally in US futures) and the outlook into summer is little changed. Russia has eliminated its tariff on wheat exports and the current intervention price suggests a floor under the world cash market at $4.25-4.501/bu basis spot CBOT. This price is also indicated in at least one major exporter surplus model. Short covering advances (like what happened this week) will occur periodically, but we maintain that seasonal lows will not be scored only in June or July. Rallies offer selling opportunities or to hedge 2015 and 2016 production.
15 May 2015

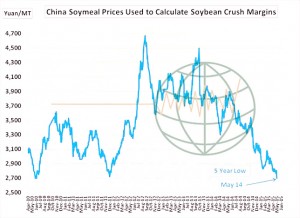
Chinese soymeal prices just can’t seem to find a bottom! This week China’s domestic cash meal market dropped to its lowest level since 2010 – down nearly 45% in the past year. Most of the decline can be based on a declining Chinese pig herd, but record large soybean imports are adding insult to the tepid demand profile. Research argues that Chinese soymeal is likely to drop another 200-300 yuan by mid-summer. This is one reason why Chinese soy importers are going slow with coverage beyond July!

To download our weekly update as a PDF file please click on the link below:

Weekly Update 15 May 2015

Our weekly fund position charts can be downloaded by clicking on the link below:

Fund positions

15 May 2015

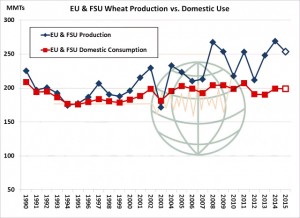
  • In the May WASDE, the USDA projected combined EU and Former Soviet Union wheat production in 2015 at 253.7 million mt, down 16 million mt from the previous year, with combined yield down 7% at 3.41 mt/ha. We have no problem with the EU’s yield, but note that the Black Sea’s projected yield at 2.16 mt/ha is some 6% below the 20-year trend. Using a trend Black Sea yield would add 7 million mt to production. Carryin stocks are up 11 million mt from the prior year, and notice in the graphic below that domestic wheat use has been relatively flat – and is forecast down fractionally from 14/15. Production will exceed total domestic use for a third consecutive year, and by a sizeable margin. The EU and Black Sea will be the world’s top wheat exporting regions again in 2015. The beginning of winter wheat harvesting is just weeks away.

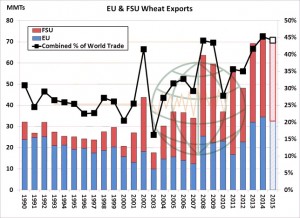
  • Combined EU and Black Sea exports will be down just slightly from last year at 69 million mt, with their world market share steady at 45% of total global trade. We expect exports to be closer to – or even exceed – last year based on favourable growing conditions, current vegetation health maps, and upward revisions to Russia’s crop in coming months. The USDA also projects the US’s share of world trade to rise in 15/16, but this will be a struggle, as we have previously suggested. However, the point is that with the EU and Black Sea combining for half of world trade, cash prices there will determine world prices – including US futures. US supply and demand has become far less relevant in recent years, as its share of world trade has fallen from 30% in 2007 to 14- 16% currently.

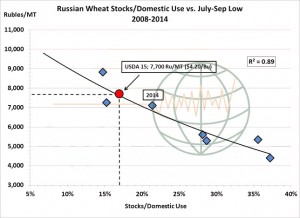
  • Seasonal lows in Black Sea domestic prices are often scored in July/Aug, and are largely a function of Russia’s exportable supply. Below is a graphic comparing Russian stocks as a percentage of domestic use, vs. seasonal lows in domestic prices in Southern Russia – where the majority of exports originate. The USDA’s balance sheet as it stands now suggests lows will be scored at 7,700 Rubles/mt. The price in Rubles is higher than last year, but the price in US$ is weaker amid this year’s collapse in non-US currencies. At today’s exchange rate, this equals $4.20/bu. This also suggests Russian fob offers will fall to $180/mt (vs. $187 currently) for seasonal lows, which is comparable to $4.30- 4.40, basis July CBOT assuming Gulf basis levels of $.60- .65/bu. A $4.25-4.75 summer/autumn range is needed for US wheat to compete in the world marketplace.

15 May 2015

  • We wish that we could find a real fundamental that would justify Thursday’s US wheat rally. EU and Black Sea cash prices were either flat only slightly higher, but Chi/KC and Minneapolis wheat futures soared on massive fund buying. As the chart below reflects, sometimes there are just too many positioned the same way and a counter/house-cleaning rally is needed. That’s what happened in US wheat futures yesterday. It is possible that wheat could add to Thursday’s gain, but we would view any rise near $5.50 Dec as a sale.

14 May 2015

  • Perhaps today’s biggest surprise has been the surge in CBOT grains, led by wheat. As the market topped last week’s high triggers were touched spurring further buying particularly by funds. With much of Europe on holiday sellers were limited and the inevitable run higher (which we have warned of previously) happened. 50 day moving averages were breached and this triggered yet more buying, however, fundamentals have not changed and at this time we continue to see this run higher as a selling opportunity.

14 May 2015

  • The USDA has today released its weekly export figures as detailed below:

Wheat: 257,400 mt, which is above estimates of minus 150,000-plus 50,000 mt.
Corn: 372,600 mt, which is below estimates of 600,000-800,000 mt.
Soybeans: 224,600 mt, which is within estimates of 100,000-300,000 mt.
Soybean Meal: 67,200 mt, which is below estimates of 75,000-150,000 mt.
Soybean Oil: 7,300 mt which is within estimates of zero-10,000 mt.

  • Brussels has issued weekly wheat export certificates totalling 517,906 mt, which brings the season total to 30,147,068 mt. The season to date total is now 2.997 million mt (11.04%) ahead of last year. As we said last night, the USDA’s latest export total stands at 34.5 million mt and with seven export weeks of the season to go this means an average weekly pace of 621,847 mt. We think this is something of a tall order!
  • Mid-afternoon and the Chicago grain markets are running higher, “Why particularly given a non-bullish report on Tuesday?” Good question, and the answer may, in part, lie in some US$ weakness as US retail sales data is described as sluggish. Added to the fund net short position (as we have frequently mentioned) this gives the market an opportunity to push higher on relatively minor bullish input. We would suggest that higher prices will see limited following but funds may seek to take profits, as today’s action suggests.
  • Wheat fundamentals continue to lean bearish with what is reported to be favourable moisture for the dry areas of the N Plains, indeed some are suggesting that the timeliness and volume of precipitation are “near-perfect” for the 87% planted spring wheat crop (well above the 10 year average of 33%). We would expect to see spring wheat acres increase and with current weather this may well lead to yield improvement which will add to overall output. As US export demand seems incapable of gathering support, the picture cannot be painted as bullish at this time.
  • In corn we may be witnessing a “recovery bounce” in prices, but unless a weather issue develops we believe upside to be limited. The bears failed to push through the post-USDA lows and this has given heat to the bulls – for now. US Farmers will view upside in prices as manna from heaven as it appears any are holding long physical old crop stocks, and an upswing in prices may offer some relief but farmer selling will ultimately cap prices. Technically we are looking at a “double bottom” formation, which could be seen as supportive and the 20 day moving average could also offer some support.
  • In soybeans the avian influenza outbreak in the US is not helping the demand story with the weaker US$ countering price weakness to some extent. Cash basis and sluggish US meal trade may well provide a trigger for traders to look for lower prices.

14 May 2015

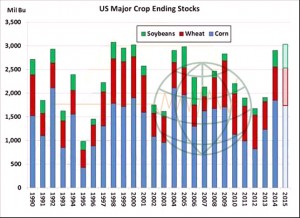
  • WASDE in their May report reflected combined 2015/16 US corn, wheat and soy stocks to be at their largest level since 1998! Such huge stocks (bearing in mind that we are in the post ethanol era) are unprecedented and reflect that demand growth growing forward has to be more robust. This is the function of the market; to reach price levels that strongly build demand or curtail production in future years. In years awash in grain, seasonal or annual lows are often scored during or at the end of harvest.