11 May 2015

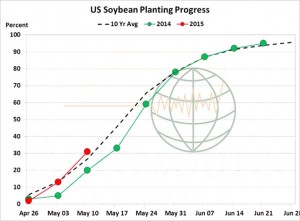
  • NASS reported planting progress last week advanced to 31%, up from 13% last week and also above the 5 year average of 20%. Rain delays across the Cornbelt look to continue in the first half of the week, followed by a warmer/drier trend into the weekend. Ahead of the May WASDE, the average trade estimate calls for old crop soybean stocks to decline by 10 million bu to 360 million – but still at an 8 year high. New crop stocks are projected even larger at 443 Mil Bu. Our long-term price outlook calls for a further decline in both old and new crop values, with July to fall to $8.50-9.00 in coming weeks.

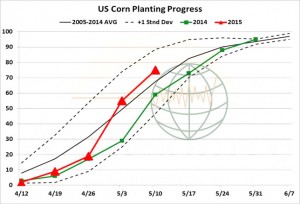
  • Planting progress through to Sunday exceeded expectations, and with two decent windows available to finish planting in the next 10-12 days the crop will likely be fully seeded by late May – and USDA on Tuesday is likely to boost yield 1-2 bu/acre above the Outlook Conference guess. Planting as of Sunday reached 75% complete, slightly better than the trade’s guess and compared to 55% a year ago. Seeding is especially advanced across the Northern Corn Belt, where in MN 90% of the crop is in the ground. Early season frosts scare will not carry as much weight in 2015. The crop is 29% emerged, and initial condition ratings are likely to be released on May 25th. As for the May WASDE, no changes are expected in the old crop balance sheet. New crop stocks will be pegged near 1,850 million bu, and major exporters’ new crop stocks/use will be higher – which is growing in importance as the US loses world market share. Key technical support rests at $3.55 basis July ’15 contract.

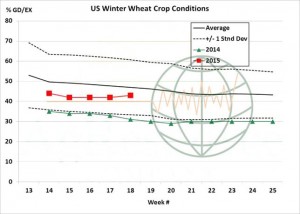
  • The market last night was just marking time ahead of Tuesday’s WASDE release, which will provide a preliminary look at the 2015/16 global wheat surplus. Winter wheat good/excellent ratings rose 1 point to 44%, right at trade expectations, and compared to 30% a year ago. Improved conditions are noted in ID, IN, MI, NC, OH and TX; declines were limited to MT, OR and WA. Tomorrow’s first US winter wheat production estimate is expected to exceed 2014’s crop by 70-100 million bu  Spring wheat seeding is now 87% complete, with the crop 54% emerged and crop conditions are due next week. Amid weekend rainfall, we peg the season’s first spring wheat good/excellent rating at 70-75%, similar to last year. Otherwise, world cash prices are unchanged, with Russian origin by far the cheapest into August. A modest uptick in 2015/16 major exporter stocks/use is expected in the May WASDE, and there still is nothing to fuel a major short covering rally.

10 May 2015

Weekly CCI Analysis:

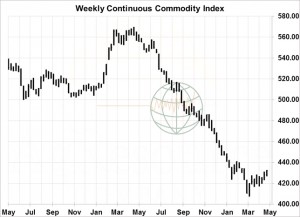
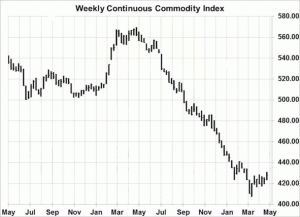
The CCI advanced to a 9 week high with stronger weekly closes noted across the commodity spectrum including the metals, energies, soft commodities and even the CME livestock markets. The move higher came as the US$ index marked the 4th consecutive week of declines on profit taking and fell to its lowest weekly close since February. The US May Employment Report was viewed as bullish and it offered some late week support for the greenback. April job growth and the decline in unemployment was viewed as positive for the economy, but the market doubts that it will trigger a FED interest rate hike in June. Our view is that an increase is likely in either September or December that will cause a secondary strong rally phase for the US$. Our broad commodity outlook remains bearish with solid resistance in crude oil noted above $60 while the grain markets should continue to grind lower on larger supplies and favorable weather and large US seedings.

Longer-term soybean analysis:

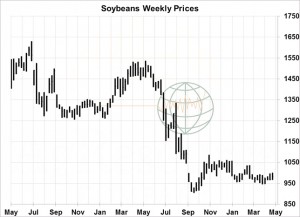
Soybeans finished with modest gains at the end of an uneventful trading week. Short covering ahead of the May WASDE report appeared to be the only real theme for the week, particularly in soyoil. Spot soybean oil futures rose to a 9 week high, but still held within the broad trading range that has developed over the last several months. Meal prices remain depressed, and Midwest basis levels continue to hold at 3 year lows and are steadily working lower. May 1st soybean stocks are estimated at a 3 year high of 890 Mil Bu, and the US export program in the remaining 4 months of the crop year are not likely to be much over 100 Mil Bu. The May WASDE is expected to show 2015/16 end stocks at a 9 year high which should allow both old and new crop soybean prices to work lower into the summer. We continue to hold a downside price target of $8.50-9.00 for July.

Longer-term corn analysis:

CBOT corn futures ended the week unchanged as the market is caught between fluctuating macro markets and complete lack of any Northern Hemisphere weather threat. The USDA’s May WASDE is due Tuesday. The report should hold bearish implications via supply increases and demand decreases. We expect the new crop balance sheet to highlight building 2015/16 US corn stocks. The US corn planting for the week ending May 2nd was the third largest on record, and another window is offered late next week and some 85-90% will likely be seeded by May 15th. Soil moisture is building across the driest areas of the N/NW Corn Belt and NOAA hints at normal precipitation and temperatures into the opening week of June. Similarly favorable weather is noted across the Europe, the Black Sea and China. Early summer lows are pegged at $3.50 basis July futures until pollination weather is known. We maintain a longer term bearish outlook on the need to compete against S America for Sep-Nov exports. China will not import more than the standard 3 MMTs in 2015/16 – mostly from the Ukraine. Harvest lows are projected at $3-3.30.

Longer-term wheat analysis:

Wheat futures closed higher for the first time in five weeks as the market takes a pause ahead of critical growing weather in Europe and the Black Sea, and ahead of the USDA’s first pass on US new crop world wheat S&D. The Wheat Quality Council’s tour pegged Kansas’s crop a few million bushels below expectations, but unlike a year ago the HRW crop will be improving in the coming weeks amid normal precipitation and temperatures. Our outlook remains bearish on rallies, with Black Sea cash prices (domestic and fob) still drifting lower, and the need to boost the US’s world market share implies seasonal lows in July between $4.25- $4.50. A period of consolidation may lie ahead, but it’s simply too early for any lasting bottom to appear. Winter wheat development remains excellent across key areas of Europe, the Black Sea and China. Russian prices must reach a bottom before a more meaningful CBOT rally effort is triggered.

7 May 2015

  • Today’s general election in the UK may well have spread across the Channel and upset our French cousins as the soon to expire (Monday is expiry day) May ’15 Matif wheat contract collapsed €10 whilst the cash market in Rouen also shed €7. The significance of the numbers is that the deferred market has not seen a similar drop reflecting nearby pressures rather than costly carries.
  • The USDA has today released its weekly export figures as detailed below:

Wheat: 298,600 mt, which is above estimates of minus 100,000-plus 100,000 mt.
Corn: 897,200 mt, which is above estimates of 450,000-750,000 mt.
Soybeans: 689,200 mt, which is above estimates of zero-350,000 mt.
Soybean Meal: 168,100 mt, which is above estimates of 90,000-150,000 mt.
Soybean Oil: 15,600 mt which is above estimates of zero-10,000 mt.

  • The data, whilst exclusively above trade expectations, was deemed to be neither bullish or bearish, just a non-event. Old crop wheat sales were again negative, to the tune of 148,200 mt, lower than last weeks figure but once again reflecting cancellations.
  • Brussels has issued weekly wheat exports of 301,414 mt, which brings the season total to 29,629,162 mt. This is another weekly decline and it is getting harder to envision the USDA’s 33.5 million mt target being hit. The cumulative export total now stands at 2.92 million mt (10.94%) ahead of last year’s record pace.
  • Chicago markets closed lower pretty much across the board as deliveries of corn against the May contract pressured futures and outside markets reversed the prior day’s gains. Crude oil has eased back $1.30/barrel, gasoline is $0.40/gallon lower and the US$ bounced off technical support levels.
  • The trade is generally aware of the production side of US balance sheets in the coming May USDA report, scheduled for release next Tuesday  normal abandonment and Outlook Conference yields plus a bit extra amid timely seedings. Focus will be on consumption growth (or contraction), particularly export demand, note US price competitiveness or otherwise. It could well be that 2015/16 end stocks may be just a bit above expectations on non-US supply. The trade has also largely digested period South American labour strikes, which are routine during the spring months. Central US weather continues to be too good at this time to permit price rallies to gather too much momentum.

7 May 2015

  • Having just returned from performing my civic duty it is now important to keep busy and not gnaw my fingernails to a stump in anticipation of the election outcome, or should I just go back to sleep?
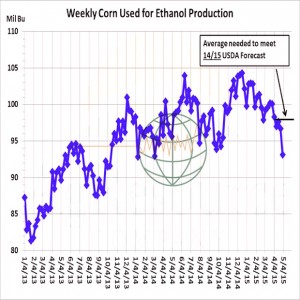
  • Yesterday saw a “bounce” as we discussed, is it fundamental? – We think not at this time. One fundamental, which impacts markets is US ethanol production and this is in sharp decline – even though production plant profits are rising – as seasonal downtime is being taken for maintenance. The chart to below reflects that the weekly grind needs to average around 97 Mil Bu in the weeks remaining in the old crop year. Otherwise, WASDE will be forced to lower their annual US corn used for ethanol production figure by 20-40 Mil Bu. Since US corn feed use is (at best) likely stagnant and US corn is not competitive against South America, the US corn market lacks a demand driver. Without adverse Central US weather, any rallies are either short covering or bounces and will likely fail.

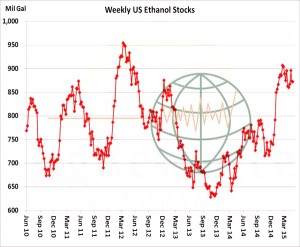
  • In terms of actual ethanol stocks, whilst weekly production may well be in decline and is seen at a pace well below that needed to meet the USDA’s target, stock levels remain well above last year, and that is despite rising blending margins. Last Friday stocks were 872 million gallons, just 1 million down week on week. Additionally, US gasoline stocks grew 400,000 barrels and remain some 7% above last year. As previously mentioned, S American corn is a discount to US supplies with bigger Brazilian discounts evident in August. The theme of increased export competition and stagnant US demand growth continues. We will doubtless see short covering rallies, particularly if fund net short positions are high, but any lasting advance in corn prices (without a serious weather issue) look hard to justify.

  • Enjoy polling day!

6 May 2015

  • US soybean crush margins in Chicago have been in free fall since a peak was reached in late summer of 2014. Notice from the chart below that margins today are down to $.55/Bu but when higher cash prices are included, some US crush plants are operating at or slightly below breakeven. Normally, US crush plants close for maintenance as Midwest farmers seed their spring crops. As farmer sales dwindle, US crushers have to raise cash bids to maintain stocks. However, in the past few days, US crushers have started to ease their cash purchases as they see no reason to take a loss on processing. The US soybean processor has to be very careful not to overpay for cash beans when US meal demand is slowing, not least in part due to the avian flu outbreak.

  • Today has seen the US$ Index fall (again) and quite sharply which has provided a bullish input into CBOT markets with corn, wheat and the soybean complex seeing some short covering. The US$ move is down to traders pushing back the date on which they expect that the Fed will raise rates, and this has moved from Jun or Sep to Dec at the earliest. US$ bulls have been unwinding longs, many of which have been in place as long as a year. Crude has been bolstered by the move with June ’15 WTI moving above $26/barrel.
  • Stats Canada pegged March 31st wheat stocks at 16.74 million mt, canola (rapeseed) stocks at 7.04 million mt, and oat stocks at 1.59 million mt. The wheat stocks total was below trade expectations, while canola was slightly above. A year ago, Canada held 8.677 million mt of canola stocks. Canadian 2015 soybean stocks were 2,063 million mt vs. last year’s 1.419 million mt.
  • Brussels updated crop S&D’s put 2015 soft wheat output at 141.6 million mt, which is a month on month increase of ½ million mt, but with 2015/16 end stocks at 15 million mt, a 1.2 million mt decrease month on month due to a 1.5 million mt increase in animal feed use. Corn output was reduced month on month by 1.7 million mt to 66.3 million mt with end stocks at 16.3 million mt, which is a 2.8 million mt month on month decrease. Perhaps the biggest surprise comes in the corn output figure, yield being the issue, with feed usage up by 1.5 million mt (having lowered it 3 million mt last month!). Given our understanding that the weather has been almost perfect (for yield) over the last month, and the EU’s MARS unit’s latest data showed a small increase in yields, it begs the question as to why the EU should spend their money on a “crop unit” and ignore their numbers! Our is clearly not to reason why! The main data is appended for your interest and late night reading pleasure – click on the link below to download as a PDF file.

Brussels S&D’s


5 May 2015

  • Chicago has seen the grains decline, wheat substantially, and the soybean complex making gains with funds seemingly securing bean oil in volume on the back of the rally in crude oil. This is the second day of fund buying in bean oil, and such events rarely last more that three days. The sagging grain prices and additional poultry flock infection with avian influenza, which will likely impact meal demand, should weigh heavier on the soybean complex before long.
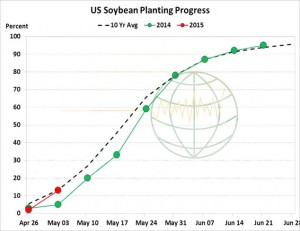
  • NASS, the USDA’s National Agricultural Statistics Service, reported US soybean planting progress at 13% completed, up 11% from last week and 4% ahead of the 5 year average. Planting across the W Cornbelt will slow this week, but the E Midwest and Delta will have chances to push US soybean seeding to 20-24% next week. Our view is unchanged with soybean futures to work lower on favorable weather and expanded US seeding, as well as the bearish tug of the grain markets.

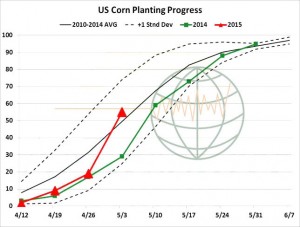
  • US corn seeding as of Sunday reached 55% completed, vs. 19% a year ago and 38% on average since 2010. 32 million acres were put in the ground and note that this week’s advance of 36% is the third largest on record. Not many more warm/sunny days are needed to complete seeding in IL and IA. Delta producers will make great strides amid continued warmth/dryness there. It in not unreasonable to project seeding to reach 70-73% completed as of May 10th, vs. 60% on 5 year average. Northern Hemisphere weather is favorable, planting concerns are all but dead in the US, and the issue moving forward is the need to boost export demand. Decent sales will continue into June, but our concern is the huge competition for trade in Aug-December and 2015/16 US stocks reaching 2 plus billion bul. Our immediate downside price target for July is $3.50/bu.

  • US wheat good/excellent ratings as of Sunday were posted at 43% (a 1% gain on the week) vs. 31% last year. Notice below that conditions this year are diverging from last year, which will be a theme into late May amid ongoing precipitation and non-hot temperatures. Ratings in KS and OK are up 1%. Other notable improvements occurred across; CO, IN, MO and OH. SD good/excellent is down 3%. Spring wheat seeding is 70% complete, vs. 40% a year ago. The spring crop is 30% emerged and winter wheat is 43% headed. Both are well ahead of last year. US wheat competes against EU origin for June arrival below $4.70 basis July Chicago, but US offers thereafter are not competitive. Normal precipitation and temperatures are projected across Europe, Russia and China into late May. Our strategy remains to use short covering rallies to extend 2015 and 2016 sales with seasonal lows pegged in a range of $4.25-4.50 in early summer.

  • Reuters reported today that Russia’s Agricultural Ministry has proposed lifting its wheat export tariff from 15th May and for the government to set a new formula for the payment. For guidance, the current tax is 15% of customs price plus €7.50, but a minimum of €35/mt. This move, if acted upon, could release as much as 8 million mt of wheat into the “available for export” category, and it is this which is likely pressuring prices lower at present.
  • Egypt, in a surprise tender, secured a further 120,000 mt of wheat for June 16-25 shipment at an average price of £205.75 C&F, which is well below the $221.39/mt paid at the last tender on 18 April. Russia and Romania each won 60,000 mt continuing to point to their ability to compete in the international tender market. The purchase did not tell is the whole picture though, the volume of offers was big, particularly from Russia, and included US (expensive), French (expensive) and Polish (expensive) in a big offer lineup. The Russian volume may well be an indicator of what is to come when their tax is finally lifted!
  • Informa Economics today released their latest estimate for the 2015 US wheat crop. They put winter wheat output to 1.486 billion bu from 1.497 billion with hard red winter wheat at 871 million bu and soft red winter wheat at 410 million bu. They declined any further explanation or commentary!
  • Finally, having been extremely busy this Bank Holiday weekend, our latest stab at EU and Black Sea corn S&D’s follow, ahead of next week’s USDA new crop report.


3 May 2015

Weekly CCI Analysis:

The CCI index continued to gain this past week on rising crude oil values along with some support for the livestock sector. The US Central Bank decided to hold its interest rates at historically low levels – but to get rid of the mention of the calendar – and rather determine when US interest rates should be normalized via inflation and US employment data. Our expectation remains that the US will see a rate increase either in September or late 2015. The US economy was sidetracked by weather and the rising US dollar during the 1st quarter, and already there are clear signs of improvement. As the US dollar starts to regain its upward momentum, we look for the CCI to restart a bearish trend with lows not expected until early autumn. Our view is that crude oil either forged a top late in the week or will in the next few weeks. The US dollar should rally on economic improvement while the ags sag on near perfect Central US weather.
Longer-term soybean analysis:

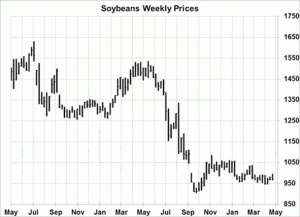
The soybean market closed slightly lower for the week in a disappointment for the bulls. News of an Argentine transportation strike and US old crop soybean sales to an unknown destination and China sparked a midweek rally. The bearish pull of falling corn and wheat futures could not be overlooked amid favorable US and world weather. US spring crops are being rapidly seeded. As the chart below indicates, US soybean values have been trading sideways for most of the postharvest period. This sideways trade has occurred during a time of rapidly building world supplies and stocks – which has been puzzling. Data shows that China has secured record tonnages of South American beans that are now afloat. This has helped underpin soybeans. The key question is whether China’s demand can continue and will it digest all of the beans that heading their way? Our bet is that China will get a case of supply indigestion and unless US weather turns problematic, that a supply bear trend will resume with a downside price target of $7.50-8.25 November.
Longer-term corn analysis:

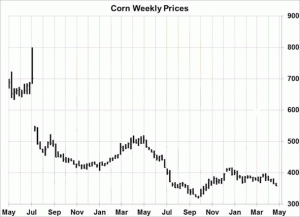
CBOT corn futures lost another 5 cents as the charts turned technically bearish and US farmers strongly advanced their 2015 corn seeding. The Central US weather forecast is nearly perfect for planting and early growth into the second half of May, with a dry and warming pattern to hold until the middle of next week across the S and E Midwest while rain falls in the west. Lingering showers return May 7-10. Unlike last year, El Niño is officially established, which should sustain normal temps and regular rains into summer. New bird flu cases are expanding across the Central US which will trim US feed demand. New crop export business will be awarded to S America and Black Sea amid sharply lower fob offers. Spot corn is nearing our initial downside target at $3.50, which holds until June crop conditions are known. Lasting heat/dryness is needed to keep the Dec ’15 contract from falling to $3.00-3.20 by harvest. Our view remains bearish with pre pollination lows expected by mid June.
Longer-term wheat analysis:

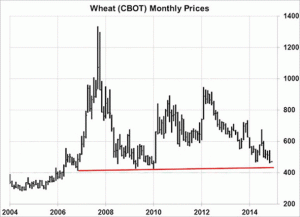
US and European wheat futures scored new 2015 lows on continued favorable weather and the pending elimination of Russia’s export tariff, which should occur by mid-May. This will affect old crop fob prices more than new crop, but world cash prices for all positions have drifted lower last week. It was another week of improved vegetative index maps across the whole of the Northern Hemisphere, and two-week weather outlooks are rather benign in W Europe, Ukraine, Russia, China and the US Southern and Central Plains. With US winter wheat production to rise 75-100 Mil Bu above last year, better exports are required to ease bulging stocks, and this is the goal of the market in 2015/16. Gulf fob offers are now required to compete with other origins, which in turn implies $4.25-4.50 spot CBOT futures for harvest lows. Seasonal lows may be posted earlier than normal amid Russia’s desire to boost intervention purchases this summer, rather than early autumn.
1 May 2015

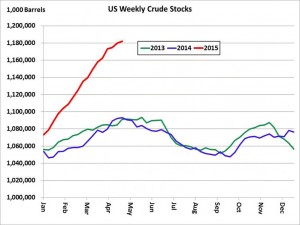
  • US crude oil stocks are rising to record highs – yet the market does not seem to care! Spot WTI futures are testing key resistance at $60/barrel and the rally has supported a view that frackers should get back to active shale gas production.
  • China has been an active crude importer as they put away cheap reserve stocks, but the world still has a huge supply imbalance that needs to be corrected. This can only be accomplished through the message of curtailed production, and this requires lower prices.
  • It feels doubtful that June WTI can muster a rally much above $60-62.00 and we would be sellers above this level.