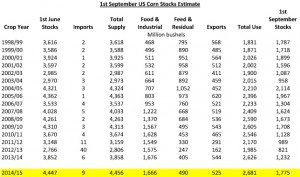
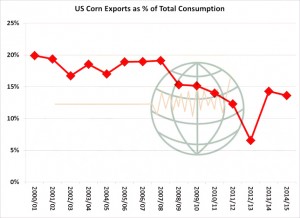
- We peg final US 14/15 corn stocks at 1,775 million bu, 43 million higher than the USDA’s forecast in the Sept WASDE, 543 Mil above a year ago and the largest since 2005/06. The primary difference between the USDA’s and our 14/15 corn balance sheet lies in feed/residual use. We calculate fourth quarter domestic corn use at 2,156 million bu, up 75 million on last year amid higher projected feed use. Fourth quarter exports are counted at 525 million bu, down 19 million on the previous year. The attached graphic illustrates the fact that in the last decade, US corn exports have made up an eroding share of total US corn use, and it’s key that this changes to spur any lasting bullish trend. Somehow US corn must regain a competitive position in world feed grain trade.
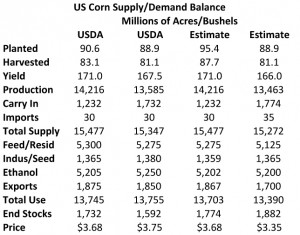
- The 20-year yield projects a 1% boost in yield in each year into 2020. Assuming normal weather, national yields in a range of 165-175 bushels/acre will be much more common in the years ahead. Without improved export demand, ending stocks, will rise to 2-2.8 billion bu, barring adverse weather. Our updated old and new crop corn balance sheets are displayed below. Assuming unchanged crop conditions in recent weeks, we’ve left yield unchanged at 166 bushels/acre. New crop production is pegged at 13,463 million bu, which is slightly above total projected consumption, and so stocks will build in the marketing year ahead. Note that as the biofuel industry has matured, domestic usage categories will be little changed in coming WASDE reports. It’s now exports that will trigger meaningful changes in ending stocks through the coming crop years. US domestic demand is expected to stagnate.
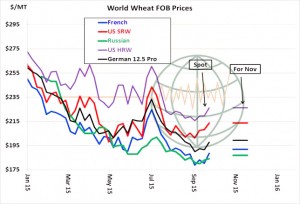
- Yesterday we saw wheat rally another 10-13 cents on continued fund short covering amid dryness in W Australia and Russia. Technical considerations also lent support as December Chicago traded through its 50-day moving average. The market has rallied 45 cents since early September. World cash markets are also just a bit firmer, with Russian wheat offered at $184/mt for spot arrival and with French available at $188. Rallies in US futures, however, will likely prevent any improvement in US export demand and notice in the graphic below, US Gulf prices remain non-competitive, and Gulf wheat’s premium to the Black Sea has widened still further. US export sales through the week ending Sept 17 are estimated at 300-400,000 mt. An average of 400,000 mt is needed to hit the USDA’s annual US export target. Complete dryness is forecast across Southern and Central Russia through the next 10 days, with some hint of improvement thereafter. Confidence in this wetter outlook is low, but it will be watched closely. Any improvement in Black Sea rains will probably trigger a quick 20-30 cent break.
- Russia’s deputy prime minister Dvorkovich has proposed a cut to its wheat export tariff to 50% of customs price minus 6,500 Roubles per tonne with effect from 1st October. This would cut the minimum tariff to 10 Roubles from 50, and it is also proposed that hard wheat is excluded from export tariffs.
- The International Grains Council (IGC) has forecast global grain stocks to hit a 29 year peak by the end of the 2015/16 season, and this would include record volumes of wheat. Global stock levels were increased by 9 million mt to 456 million largely on the back of an optimistic outlook for wheat output, as well as higher barley, sorghum and oats volumes. 2015/16 global wheat output was forecast at a record 727 million mt, which is a 7 million mt increase on last year’s previous record. Improved EU prospects, where production of 155.5 million mt was forecast, were a significant factor and showed a 3.6 million mt uplift from the previous estimate although this remains behind last season’s 156.2 million. Increases in output estimates for both Russia and China also bolstered the IGC’s outlook.
- Global corn prospects for 2015/16 were eased 1 million mt to 967 million mt, well below last year’s record 1,005 million mt. The likely switch from corn to wheat feeding left the IGC’s end stocks figures less dramatically changed.
- The USDA has today released its weekly export figures as detailed below:
Wheat: 313,700 mt, which is within estimates of 250,000-400,000 mt.
This year 282,800 mt; Next year 30,900 mt.
Corn: 426,300 mt, which is below estimates of 550,000-750,000 mt.
This year 426,300 mt; Next year zero mt.
Soybeans: 1,316,000 mt, which is above estimates of 1,100,000-1,200,000 mt.
This year 1,316,000 mt; Next year zero mt.
Soybean Meal: 112,700 mt, which is below estimates of 120,000-275,000 mt.
This year 25,800 mt; Next year 86,900 mt.
Soybean Oil: 66,800 mt, which is above estimates of zero-40,000 mt.
This year 18,800 mt; Next year 48,000 mt.
- The figures are less than exciting with year on year new crop sales all lower; wheat is 13% down, corn 30% down and soybeans 35% behind.
- Brussels has issued weekly wheat export certificates amounting to 594,667 mt, which brings the season total to 5,196,935 mt, which is 911,621 mt (14.92%) behind last year.
- Chicago markets have traded either side of unchanged with debate raging over the size and importance of China signing what are known as Mutual Letters of Understanding relating to soybean sales commitments. Suggestions that as much as 10 million mt is covered, although split over two crop years. Corn and wheat prices are again suffering with slow US exports as well as news of Russia’s proposed (modest) cut in export tariff that should allow consumers to buy with confidence in their likely fob price.
- Outside markets are mixed with the US$ a touch weaker, crude is up $0.40/barrel, gasoline a touch weaker and US equities lower for the third consecutive day. Make what you will of that lot!


