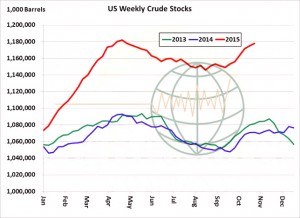
- US crude oil stocks continue at burdensomely high levels, and this is serving to cap and limit rallies. Until this oversupply is worked through via better consumption, we doubt that ethanol production and blending margins will improve much. The EIA today pegged crude stocks as of last Friday at 1,178 million barrels, up 10% from last year. Unleaded gasoline stocks are up 7% from a year ago and ethanol stocks are up 9%. Lasting rallies in energy prices are not expected into early 2016.
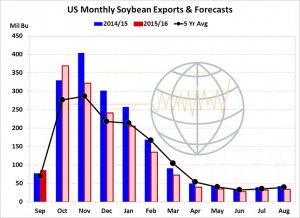
- Official US soybean exports for the month of September were reported this morning at 86.4 million bu, similar to what had been indicated by the FAS monthly inspections report that was released in early October. The September total was at a three year high and the second best monthly total on record due to adequate stocks and building Asian demand. A strong shipment pace has continued through October a record or near record export total is expected for the month. A peak in weekly shipments has been reached/nearly reached, and we expect weekly monthly totals to now decline. Initial Brazilian exports will be available in February, which will bring US exports to a crawl in the remainder of the year. We see the USDA forecast at 1,675 million bu as too high by at least 75 million.
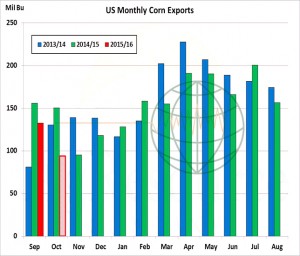
- Official US corn exports in September totalled 132.6 million bu, down 24 million from a year ago and down 23 million from September of 2014. Using weekly FGIS shipment data, we peg corn exports in October at a meagre 94 million bu, down 56 million from last year. Total Sep-Oct shipments of 227 million are down 80 million (20%) from a year ago, and recall the USDA’s 2015/16 export projection is unchanged from the previous year. Notice in the graphic that there’s strong seasonal tendency for shipments to rise beyond February – as soybean exports more or less come to a halt – but this is accounted for in year on year analysis. The US must average exports of 162 million bu in each month moving forward, and assuming shipments are not boosted until beyond February, exports must average close to 190 million in the second half of the crop year. This is not expected, as outstanding sales are down 35% from last year. The USDA’s forecast is too high.
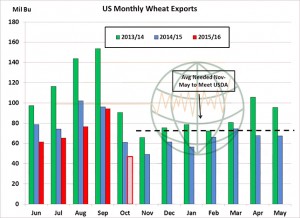
- US wheat exports in September totaled 94 million bu, up 18 million from August but down 2 million from September of 2014. A sharp decline in official shipments is expected in October, as FGIS data indicates exports of just 47 million bu, down 14 million from the year. Jun-Oct US wheat exports are tallied at 345 million bu, down 67 million (16%) from last year, and we struggle to see a boost in exports in the foreseeable future. Jun-Oct shipments account for just 41% of the USDA’s, which is an historically low number, and in recent years improvement beyond Oct has hinged upon export controls or adverse weather in the Black Sea. Without adverse weather, we expect the USDA to eventually lower its forecast 10-25 million bu to a new multi-year low. US origin wheat is the world’s most expensive for delivery into February.
- Today saw the Bank of England leave interest rates unchanged at 0.5% once again as weak inflation data leaves the timing of a rate increase ever more uncertain.
- The USDA has today released its weekly export figures as detailed below:
Wheat: 105.600 mt, which is below estimates of 300,000-500,000 mt.
Corn: 574,900 mt, which is within estimates of 450,000-650,000 mt.
Soybeans: 656,500 mt, which is below estimates of 1,400,000-1,800,000 mt.
Soybean Meal: 256,300 mt, which is within estimates of 150,000-350,000 mt.
Soybean Oil: 36,200 mt, which is within estimates of 10,000-80,000 mt.
- As a consequence of what can only be described as weak US export data markets moved lower today. Both wheat and soybean figures were well below trade expectations and some are now questioning whether we have seen peak Chinese purchasing of soybeans following an extraordinary first half October volume. For their respective crop years to date, the US has sold 1,026 million bu of soybeans, down 22% from a year ago, 518 million bu of corn, down 32% from last year, and 472 million bu of wheat, down 17%. The market has lost interest in the pace of shipments, and has turned to its focus to the pace of new demand.
- It’s becoming more evident with each weekly sales report that the USDA is overstating corn export demand by some 100 million bu. Wheat exports are viewed as slightly too high assuming normal N Hemisphere weather, and following this morning’s report, the trade is questioning soybean exports. Recall the USDA projects US soybean exports to fall just 10% in 2015/16. January soybean prices are closing in on September’s lows.
- Brussels has issued yet another relatively low week of wheat export certificates of 386,976 mt. This brings the season total to 7,959,806 mt, which is 2,439.600 mt (24.46%) behind last year.


