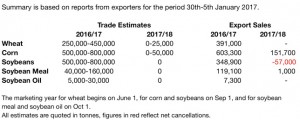
- US export data was released as follows:
- Brussels has issued weekly wheat export certificates totalling 338,080 mt, which brings the season total to 14.37 million mt. This is 393,186 mt (2.66%) behind last year. Barley exports for the week reached 110,386 mt, which brings the season total to 2.27 million mt.
- The 2017 USDA January Crop Report was considered slightly bullish for US corn/soybeans amid falling 2016 production, while Chicago wheat prices rallied on a 10% fall in US winter wheat seeding. US 2016/17 corn stocks also declined 48 million bu on a hike in US ethanol production and fall in the US yield/harvested acres. The big surprise was the drop in 2016/17 US soybean end stocks to 420 million bu, a drop of 60 million which accounted for the smaller US production. The smaller US old crop harvest is going to accentuate the importance of S American crop sizes and production in the weeks just ahead. Chicago will likelyl not fall into a lasting bearish price trend until large S American crops are confirmed. The USDA data will likely maintain Chicago prices within the prior range without adverse S American weather. NASS dropped their 2016 US corn yield by 0.7 bushels/acre to 174.6 bushels/acre with harvested acres falling 100,000. The US 2016 corn yield and production is record large at 174.6 bushels/acre and 15,148 million bu.
- 2016/17 US corn end stocks fell to 2,355 million bu, down 48 million from December based on a 78 million bu fall in the US 2016 crop, an increase of 25 million bu in ethanol, and a 50 million bu cut in feed/residual use. December 1st US corn stocks at 12.4 million bu came in 100 million above trade estimates, and 1.2 million bu above last year. The change allowed for US corn average cash price to be raised by 5 cents/bu to $3.40. World 2016/17 corn stocks were lowered 1.4 million mt to 221.0 million mt. Brazilian corn production was left at 86.5 million mt, Argentina at 36.5 million mt, while S Africa held at 13.0 million mt. The lower world corn stocks were mostly due to US adjustments in production.
- US 2016 soybean production was lowered by 54 million bu due to a 300,000 acre decline in harvested acres and a 0.4 bushels/acre drop in yield. US soybean imports were cut by 5 million bu leaving total 2016 production to fall 59 million bu. With the addition of 1 million bu to the residual, total 2016/17 US soybean stocks fell 60 million bu to 420 million with the average US farmgate price raised to $9.50. The US January S&D argues for US soybeans to hold between $9.50-10.50 into spring. World 2016/17 soybean end stocks fell 82.3 million bu with much of the decline coming from the US. The 2017 Brazilian soybean harvest was raised to 104 million mt, while the Argentine crop held steady at 57 million. The 2016 Chinese soybean harvest was raised to 12.9 million mt from 12.50 million mt. Many would argue that the Argentine soybean crop estimate is too large by 2-5 million mt.
- We calculate September-December US wheat feed/residual use at -32 million bu with US corn feed/residual use at a record large 2,269 million bu. US soybean residual use is calculated at 197 million bu. The US corn and wheat feed/residual use totals were below trade expectations, and slightly bearish. US 2017 winter wheat seeding fell by a larger than expected 3.7 million acres to 32.8 million. Kansas planted 1.1 million acres less than 2015, while Texas and Oklahoma seeded 500,000 acres less. The 2017 NASS wheat seeding data argues total 2017 US wheat harvested data will be just 40 million acres. US 2016/17 wheat end stocks were raised to 1,186 million bu. US feed/residual use was lowered by 35 million bu to 225 million bu. We would expect another 10-15 million bu in its feeding estimate. This would leave 2016/17 US wheat end stocks at or just above 1,200 million bu which is more than enough wheat to cap rallies in spot Chicago futures at $4.30-4.40. We see nothing in the USDA January report that is going to kick prices out of the current sideways trend. Only adverse weather can lift spot Chicago corn futures above $3.75, spot Chicago soybeans above $10.60, and spot Chicago wheat futures above $4.40. Longer term, the “big crop” vs. “big demand” scenario will shift more to just a big crop with prices to drift lower into the US spring planting season. Adverse Argentine weather forecasts have to be monitored as their key reproductive period of the growing season comes from late January into March.

