17 June 2015

  • It has been another day of gains in Chicago as the trade debates what could wet weather mean for US seedings and yields in both corn and soybeans. Some ponding and low level flooding was noted last year in mid-June across Iowa and E Nebraska with this year’s flooding taking in N Illinois and parts of W Indiana. It will be the weather next week that will be key in terms of a needed warm/dry period. On the bright side, Midwest soil moisture levels are estimated to be the best since 2010 but there seems to be agreement that recent rains have taken the edge off yields in MO, IL and IN.
  • Overnight saw China announcing that it is scrapping its programme to stockpile rapeseed/canola and will offer growers subsidies instead, starting with their imminent harvest. This seems to be a replication of what happened last year in soybeans and cotton in that the government no longer wants to offer high minimum prices and consequently build their own domestic stockpiles. The news is bearish for global rapeseed/canola and it begs the question, are the grains going to follow in terms of reduced minimum pricing.
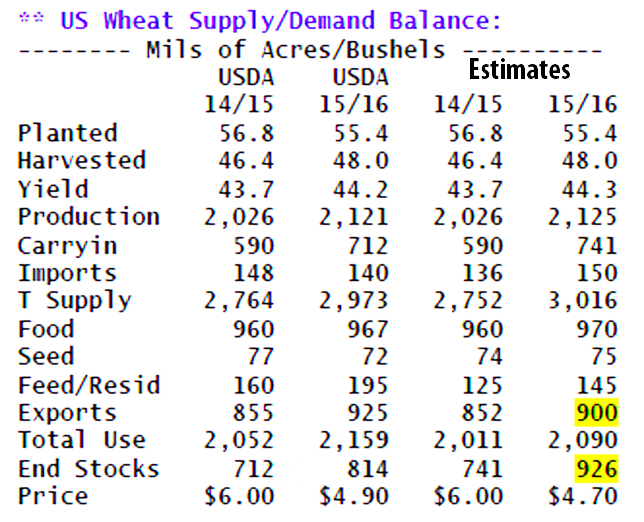
  • A more in depth review of the US wheat stocks position follows:

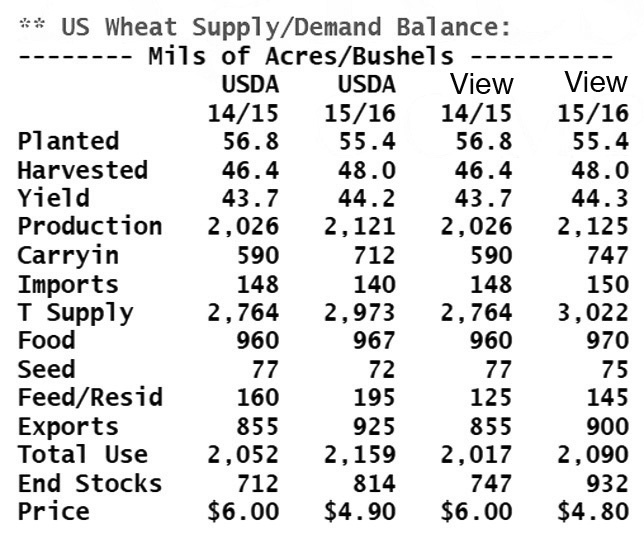
  • The highlighted 2014/15 line in the table above projects final 2014/15 US wheat ending stocks at 741 million bu. This is up 29 million bu from the USDA’s forecast in its June WASDE and down just marginally from prior estimates due to lower projected imports in the Mar-May quarter. Year-end stocks of 741 million bu are the largest since 2011, while annual stocks/use at 36.8% is the largest since 2009. Lofty stocks are well known, but the issue ahead is that stocks will continue to build. US wheat is in a demand-led bear market.
  • We peg final 2014/15 exports at 852 million, down just slightly from the USDA’s 855. Final imports are estimated at 136 million bu, vs. the USDA’s projected 148 million. However, we expect feed use in the final quarter to be heavily negative, with the USDA’s annual feed/residual forecast some 35 million bu too high. There’s no shortage of wheat, and even early harvest reports across the far Southern Plains have been encouraging. Moving forward, we are in agreement with the USDA’s production estimate, though there’s room to grow the spring and durum harvests amid normal summer weather. However, it is demand that remains overstated – exports in particular! US exporters will struggle to reach even 900 million bu in 2015/16, and total consumption in the coming marketing year is expected to grow by just 4% – while the total US wheat supply will increase 9%.

  • The graphic below illustrates current world fob price relationships for delivery in the July-September period. Like the past12 months, US Gulf wheat is poorly positioned to sell anywhere outside of already captive markets (favoured nations in E Asia, Africa and the W Hemisphere). Gulf SRW is even priced near parity with much better quality German origin into August, and HRW is offered at a lofty premium of $34-46/mt ($.90-1.00/bu) to all other origins. A year ago, US wheat was far more competitive and without a crippling drought in Australia in September, US exports may even decline on the year (sub 850 million bu) taking 2015/16 US wheat stocks near 1,000 million bu. It is stocks/use, rather than simply stocks, that will cap rallies above $5.25 spot Chicago, into late 2015. Harvest lows could form near $4.40-4.60.

  • Finally, the German Co-op association has downgraded their crop estimates on account of dryness as follows:

  • The above data has brought some further focus to the trade, particularly to dryness is N France where conditions have arguably been dryer than in Germany, and shows little relief in the next 10-14 days. If the downgrade in the German crop was replicated across the whole EU we would be facing a 12 million mt crop reduction (vs. the USDA’s 6 million mt). Clearly the other side of the equation remains, where is the demand, and this is perfectly valid – but do not underestimate the farmers willingness to “shut up shop” in the face of a crop issue – if that is what we are about to see.

16 June 2015

  • Turnaround Tuesday folklore comes to life once again as soybeans see short covering offering support. Yesterday’s failure to close at a new low saw the bulls emerge from their lair. Slightly lower soybean seeding progress in KS/MO despite a drier forecast saw prices higher.We doubt the market’s ability to maintain upward momentum as the forecast suggests dry and warm conditions next week. Plentiful soil moisture levels also suggest that there is little to raise concern over planting delays across MO and KS.
  • Corn and wheat prices have lagged behind the soybean rally as the wheat harvest is only just around the corner and most of the corn acres are now planted. Weather forecasts have little, if anything, in the way of extreme heat to disrupt pollination, which could prolong any rally.
  • More topically today is tropical storm Bill that is hitting the headlines. The remains of the storm are looking likely to push through the E Plains and into AR/MO as well as S IL. Heavy rainfall is likely across the E Plains with maybe 0.5”/2.5” across MO, IL, IN. Warmer and dryer conditions are forecast to follow, which will aid both planting and crop development.
  • Matif wheat and corn markets have been described as “desperately” quiet as AgriMer forecast lower French wheat stocks for 2014/15 at 3 million mt, 600,000 mt below their last estimate, as EU export volumes continue to flow at a rapid pace. The volume of French soft wheat exports (non EU) is put at 11.1 million mt, up from 10.6 million mt previously estimated.
  • To conclude, a couple of longer term thoughts suggest that in wheat, projected Russian wheat output at trend yield, which is 5% below last year together with the USDA’s area forecast gives an output of 59.5 million mt. The USDA’s latest forecast of 55 million mt suggests a 12% decline in yield year on year. Few suggest that this is likely this year. In corn, there is no immediate weather issue and US farmers continue to hold large old crop stocks. S American corn will be coming to market at the same time as the US harvest! In soybeans we can find little evidence that the “big picture” has changed.

16 June 2015

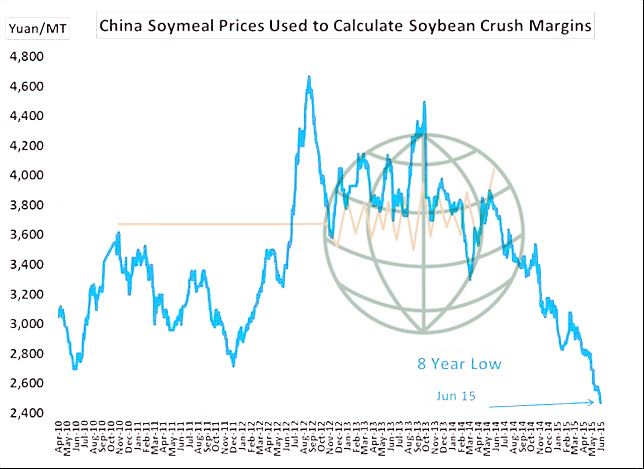
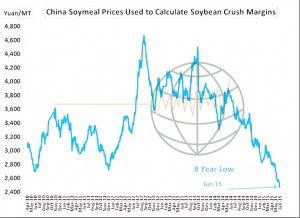
The Chinese soybean meal market has accelerated its decline and most market sources now argue that China will have to more aggressively export soybean meal to rid itself of excess supply. With record soybean imports arriving, this may take until the end of the summer. Chinese soybean meal prices now rest at an 8 year low and there is no bottom in sight with cash defaults accelerating. Falling soybean meal prices in China (and around the globe) are likely to pressure crush margins. This looks like the last supportive peg for $9.00 spot CBOT soybean futures.
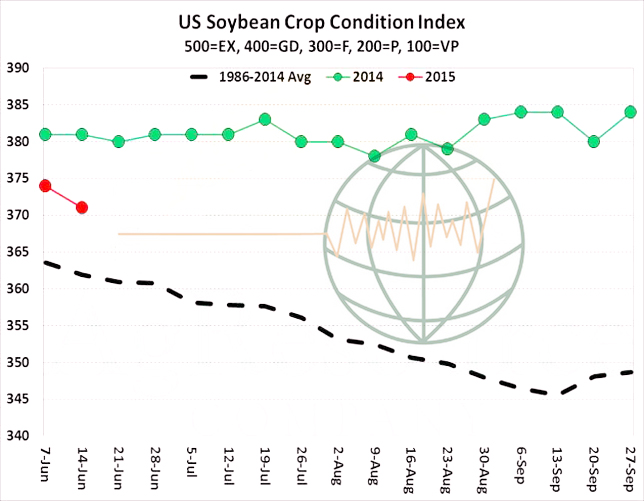
NASS reported soybean planting progress on a national basis advanced to 87%, with 11 states more than 90% complete. National crop ratings were little changed, with good/excellent down 2% at 67%, while the index of all crop ratings was down slightly. As seen in the chart below, the index of all ratings continues to reflect a very high rated crop and we see no reason to disagree with the June WASDE yield of 46 bu/acre. With adequate old crop stocks and favourable new crop ratings, we hold to a view of selling rallies for a decline to $8.40-8.60 by mid to late July.

Corn crop conditions as of Sunday were pegged at 73% good/excellent, down 1% from the previous week. Declines of 2-8% are noted across the E Corn Belt due to wet weather. Note that IA’s crop improved 2% to 82% good/excellent. Modest boosts also occurred across the S and C Plains. Some yield projection models maintains a forecast of 166-169 bu/acre! The crop is 30-90% silking across TX & the Delta/Southeast. Steady/higher conditions are expected into late June as excessive precipitation ends beyond the next 3-4 days.

NASS’s weekly wheat crop update featured only minor changes to US wheat conditions. Winter wheat is rated at 43% good/excellent, unchanged from the prior week. The largest downgrades occurred across the S and E Midwest amid excessive rains. PNW ratings improved 2%. Spring wheat is rated at 70% good/excellent, up 1% point on the week amid small improvements in the Dakotas. US winter wheat is 11% harvested, vs. 15% last year, though this progress will accelerate into late June amid reduced precipitation and at least average temperatures.

Dryness concerns in Europe have eroded, and now include just portions of Germany and N Poland. Canada will see normal to above normal precipitation through the next two weeks. Moderate to heavy rains are scheduled across Eastern Australia in the next 48 hours, and so major world production threats are lacking.

Finally, recall that through the week ending June 11th, funds in the US liquidated a sizeable portion of their net short position. It is now back to monitoring the Black Sea’s surplus in determining ultimate seasonal lows in world cash market. A retest of $4.60-4.70 spot Chicago futures is expected in the next 2-3 weeks. Short covering rallies will be capped above $5.10 basis July Chicago.

15 June 2015

  • The week has started generally lower, CBOT and EU markets all saw losses in some shape or form. Wheat and corn led the way lower in Chicago whilst July soybeans traded either side of unchanged and the new crop was pressured by favourable weather conditions. Front month wheat in Chicago broke below its 50 day moving average triggering further sales including funds. If fresh seasonal lows are scored we will doubtless see additional fund participation with further selling. July corn tested and made fresh contract lows although it actually closed at a level equal to the previous contract lows. The signs look strong for a retest in coming days.
  • There have been rumours of additional Chinese DDG defaults as Chinese importers experience “difficulties” in opening Letters of Credit. There are suggestions that China is preparing to drop the minimum corn price loan to farmers and offer a heavily subsidised rail price to allow movement of corn stocks from the heavily stocked NE into the SE of the country. Importers and end users are consequently more cautious on new purchases as well as shipping of existing contracted purchases. Soybean meal prices in China slipped again to a fresh eight year low.
  • Australia’s ABARES issued a revised 2015/16 wheat crop forecast 800,000 mt lower at 23.6 million mt. They also reduced their canola (rapeseed) forecast by 290,000 mt to 2.97 million mt. Both reductions were attributed to the onset of El Niño conditions, which are expected to impact output negatively with its likelihood of dry conditions.
  • France’s AgriMer placed the wheat crop at 87% good/excellent, which is a 2% reduction week on week although an improvement from 73% year on year. Winter barley, which is due to begin harvest any day now, was also rated 2% lower week on week at 86% good/excellent. Spring barley saw a bigger reduction at 86% good/excellent, down from 91% week on week. Corn was rated 84% good/excellent, again a 2% week on week reduction.
  • European weather conditions saw rain continuing to push north today as only the northers third of France, N Germany and NW Poland without. The rain is forecast to move east bringing significant precipitation on Tuesday into the Balkans and W Ukraine. This is expected to continue Wednesday leaving most of Europe dry. Thursday and Friday sees significant rain in N Germany, Denmark and Poland and N France appears to have to wait until the weekend to see any volume of rain. Fortunately, there is a lack of any appreciable heat, which could be damaging in dry conditions. S Russia appears to be blessed with regular rainfall most of the week. All in all, the forecast appears to be beneficial to current crop production.

13 June 2015

Weekly CCI Analysis:

The CCI/CRB commodity index tried to rally this week, but failed on the prospect of rising US interest rates and a stronger US$. The US FOMC will be meeting this next week to decide when US interest rates will start to be normalised. The expectation is that the US Central Bank will hold rates steady, but it will suggest that the first US rate change in 6 years will be offered during either the September or December meetings. The US$ rallied on the prospect of a rate rise while Greek debt repayment remained a worrisome event for the European Central Bank and the IMF heading into the end of June. Research maintains that crude oil is caught in a range of $48-64.00 into year end and we remain sellers above $62.00. A seasonal high should be forming in crude which will allow the CCI index to forge new lows by late summer or early autumn. We are bearish the CCI on rallies

Longer-term soybean analysis:

Soy futures finished the week mixed with old crop beans fractionally higher while November was slightly lower. The June WASDE did not hold any bullish surprises, and market focus is on new crop conditions and global trade/price trends. China continues to suffer from soy oversupply and both spot and forward crushing margins turned negative for the first time in over a year. S American premiums on beans and meal both continue to work lower offering an import chance into the US. Planting progress through Sunday night is expected to reach 86-88% while crop ratings will remain historically strong at 69-71% good/excellent. Without a major weather threat, the outlook for the soy market remains bearish amid excessive supplies and record large new crop production. Our downside price targets for July rest at $9.00 and $8.40-8.60 November for a summer seasonal low. During harvest Nov could slide to $8.00.

Longer-term corn analysis:

CBOT corn futures settled the week down 7-9 cents in old and new crop positions. The highlight this week was a higher Brazilian corn estimate (81 million mt) from both the US/Brazilian governments and additional hikes are expected in the coming months. S American corn production in 2015 will be record large, and exporters there will begin to dominate world trade by late July/early August. USDA also raised US corn stocks modestly on a lower projected industrial use due to this year’s surge in ethanol yield. There is a concern over too much rain scheduled in the next 3-4 days across E KS, IA and MN, but we can find no real correlation between excessive June precipitation and final US corn yield. The broad theme of 2015/16 will again be huge competition in world feedgrain trade, which based on fob relationships will favour S America beyond the next 20-30 days. We maintain that short covering rallies should be used to extend or make forward sales. The risk is sub-$3.00 Dec corn at harvest amid lacking US demand growth and strong yield potential. Spot corn rallies will likely be limited to $3.70 without the unexpected development of a dire US/Chinese drought.

Longer-term wheat analysis:

US and European wheat futures ended down on the week as the USDA hiked major world wheat exporters’ production – including the US – in its June WASDE. The highlight was the 2.5 million mt rise in the Black Sea harvest, which was put into exports. This will keep fob offers depressed throughout the coming months. Black Sea prices are the world’s benchmark in the first half of the crop year, and Russian wheat continues to be sold into N Africa at $190/mt or below. This is comparable to $4.60-4.70, basis spot CBOT. Weather is improving across France, S Germany and whole of the Canadian Prairies, and without dire weather in Australia or Argentina, global wheat stocks look to exceed 200 million mt in 2015/16. The goal of the market is to elevate US wheat exports or the US will be left with end stocks near 1,000 million bu. A range of $4.50-5.25 is indicated into late 2015. Wheat quality across the far S Plains (TX/OK) has been reported to be above miller’s expectations.

13 June 2015

Chinese soybean crush margins in both a spot and forward positions have slipped to negative levels for the first time in a year. Chinese cash soybean meal has imploded in recent months to their lowest price in 8 years! In fact, the spread between Chinese soybean meal vs. the US Gulf is at a record low premium of just $32/ton Chinese premium. China is more aggressively offering meal for export into SE Asia which relative to the US, is competitive. The Chinese crush is seasonally ramping up.

11 June 2015

  • In a broad sense, the USDA June NASS and WASDE reports held few surprises! Traders will now look to the NASS June 30th Stocks & Seeding report and US/world weather for price direction. It’s all a question of new crop supply. The June Stocks report will likely report a sizeable rise in US corn and soybean end stocks from prior years, but it is seeding changes that will garner all of the market attention. Will 2.4-3.2 million acres of Prevent Plant acres get seeded this year when compared to 2014? It has been a nice spring for seeding across much of the Central US (except for KS/MO). Even in the Plains, producers tell us that they are going to utilise all of the soil moisture and seed additional acres to sorghum/soybeans. Sharp falls in 2015 US corn, soybean or spring wheat seeding are not expected to be uncovered on June 30th. If there was a surprise in the June WASDE report it was that 2015/16 US biodiesel demand was not raised substantially! WASDE estimated 15/16 US biodiesel use at 5,100 million pounds, a 2% increase from May. Such an increase, with WASDE having time to fully analyse the impact of the new EIA RFS proposal, was disappointing. Such a soy oil production increase would only require an additional 8.7 million bu of soybeans! Also, Black Sea and European total 2015/16 wheat supplies will be equal to or above last year. There will be no shortage of world wheat with major world exporters all competing for trade that is not any larger than 2014/15. For a lasting trend change in world/Chicago grain/soy prices requires adverse weather. Normal weather will produce a grind lower into late July.
  • The USDA raised both old and new crop US corn stocks. In old crop, this is a function of lower projected ethanol use, which in turn is a function of this year’s surge in ethanol yield (2.85 gal/bu, vs. 2.74 in 2014). New crop stocks were hiked amid larger carryin supplies. Season average price forecasts were left unchanged. Major balance sheet changes await the June Stocks report due at month end, but we still view the USDA’s total old and new crop consumption estimates as overstated. The pace of old crop export sales has been fading rather quickly in recent weeks, while a surge in S American production this year will limit export demand through the Aug-Jan period – and new crop exports are projected to be down noticeably from the current year. Remember that feed/residual is tracking well below the USDA’s forecast for two quarters, and a demand led bear market remains intact. 2015/16 end stocks of 2.364 billion suggest harvest prices of $2.90-3.10.

  • The world balance sheet changes that provided the catalyst for weaker CBOT corn trade on Wednesday:
  • The USDA increased Brazil’s harvest to 81 million mt, up 3 million mt from May following ongoing rains in early May – and better than expected yield reports. Similarly good weather sparked a 0.5 million mt hike in Argentina’s crop. And new crop Russian production and exports were raised 1 million mt amid a surge in seeding in Southern Russia. USDA boosted old and new crop world trade to account for record total supplies in major exporting countries, but it’s still giving the US too much market share. Gulf corn is not competitive beyond July – even into traditional destinations – and rather than build stocks to a record 20 million mt, we expect Brazil to be a dominant exporter in the Aug-January period. Total Black Sea supplies are projected down just 0.5 million mt from 2014/15. All of this leads to a highly competitive world corn trade in 2015, which is not bullish for futures prices or fob premiums. Adverse weather is required to lift Dec corn above $3.90 for any length of time. Also do not underestimate the impact of corn upon wheat markets!

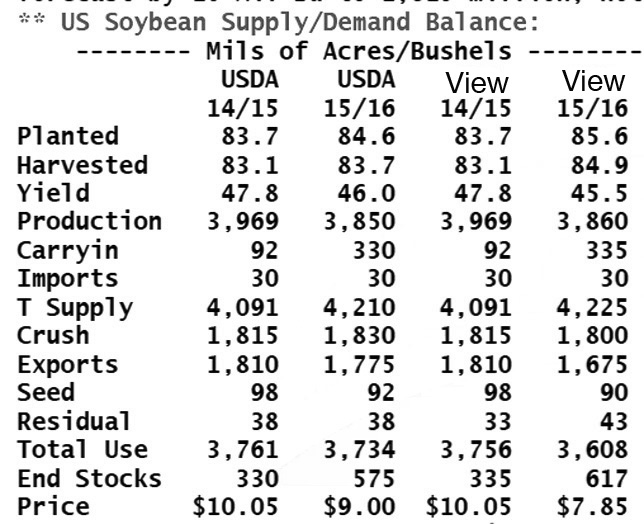
  • The USDA made a few minor tweaks to the soybean balance sheet estimates, but the final message was left unchanged: old crop soybean supplies through to the end of the year will exceed that which is demanded, while stocks will further inflate next year! In the old crop balance sheet the USDA raised the crush forecast by 10 million bu to 1,815 million, noting better than expected domestic soymeal disappearance, while exports were also increased by 10 million bu to 1,810 million. Stocks were thus reduced by 20 million bu to 330 million bu and the season average price was lowered by a nickel to $10.05/bu. In the new crop, there were two minor adjustments. The first was the lower carry in, while crush was increased by 5 million bu to 1,830 million. End stocks were lowered by 25 million bu to 475 million and the season average price was unchanged at $9/bu. The report was anything but bullish, and we expect that NASS will find another 1 million acres in 2015 US soy seeding.

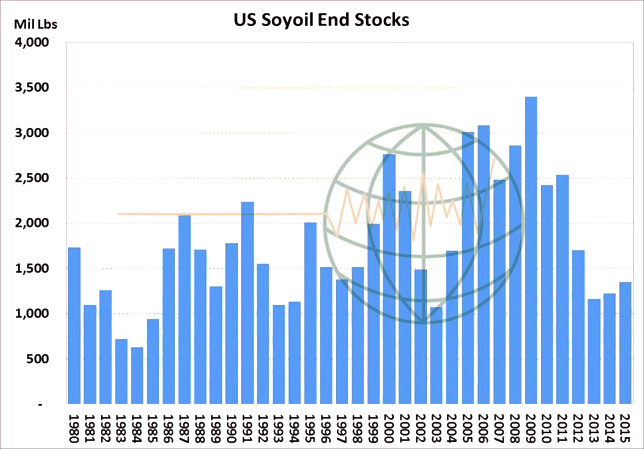
  • In the soy product balance sheet, both meal and oil production increased due to the larger crush forecast, while old crop meal exports were lowered by 100,000 short tons to 12.7 million tons. The soybean oil yield was lowered fractionally while imports increased by 25 million lbs to 225 million. The USDA increased biodiesel use by 100 million lbs to 4,900 and food/feed/industrial use increased by 50 million lbs. Year end old crop stocks were lowered by 15 million lbs to 1,225 million and the season average price increased a penny to 33 cents/lb. In the new crop balance sheet the USDA raised biodiesel use by 100 million lbs to 5,100 million. Food/feed/industrial is expected to remain unchanged from 2014/15, though the FDA is expected to release it’s final decision on a trans-fat ban next week. This could have major impact on domestic food use going forward. The season average price forecast range increased by a penny to 30.5-33.5 cents, which should cap new crop soybean oil rallies at 35-36 cents. July soybean oil above $.34 looks fully priced.

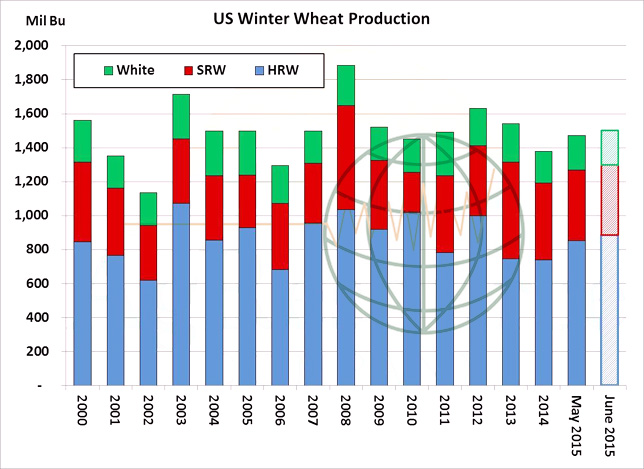
  • NASS lifted US winter wheat production 33 million bu to 1,505 million, well above prior trade expectations. This is largely a function of a bigger projected harvest in KS, where recent rainfall has been helpful and will at least add to quantity. The KS crop was increased 43 million bu to 315 million. Other minor boosts are noted in MT, NE and CO, which offset reductions of; 3-11 million bu in OK, SD and TX. Total HRW production is pegged at 887 million, up 34 million from NASS’s estimate in May. SRW production is estimated at 414 million, down 2 million from previously. Winter white is estimated at 204 million, up 1 million. Of note, without improved exports – which are unlikely amid heavily overvalued fob premiums – HRW stocks in 15/16 will surge to 420-430 million bu, vs. 282 in 14/15 with stocks/use projected at a record 55%.

  • The USDA in its all-wheat balance sheet raised old crop stocks 3 million bu amid slightly reduced exports. New crop stocks were lifted 15 million bu to 814 million. The USDA has acknowledged the potential for reduced quality across the S Plains, and so boosted feed use 15 million bu, which was not enough to offset higher production and carry-in supplies. We await the June stocks report for final end stocks confirmation, but we expect feed/residual use to be revealed some 70 million bu below the USDA’s estimate. New crop exports are overstated – perhaps significantly so – amid a slow pace of sales to date and no sign of competitive Gulf offers into September. Sub-$5.00 wheat will likely return in the weeks ahead, and the USDA’s world balance sheet adjustments confirmed that the US will be a very modest world player in 2015. US end stocks will approach 1.0 billion amid lacklustre exports and with favourable N Plains weather.

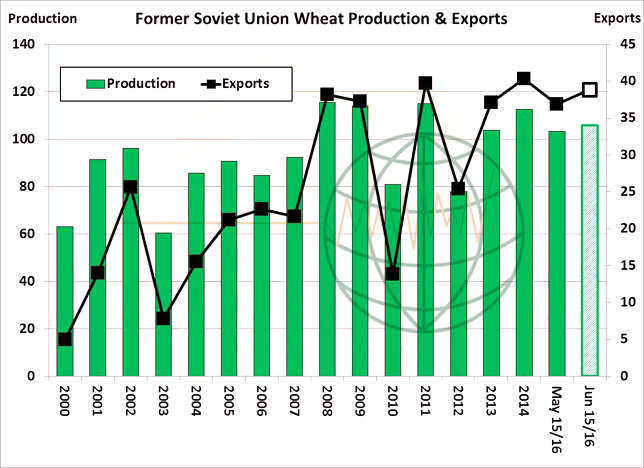
  • World wheat production in 15/16 was raised 2.6 million mt to 721.5, while total consumption was raised 3 million mt. Total global wheat stocks are pegged at 202.4 million mt. This is down 900,000 from May but is 2 million mt above 14/15 and is the highest since 2001. The highlight of the world numbers is a 2.5 million mt increase in Black Sea production (1.5 million mt in Russia, 1 million mt in Ukraine), most of which was put into exports. Total FSU production is projected at 106 million mt, down 6 million mt from 2014. However, amid larger carry-in supplies, total FSU wheat supply is down just 3 million mt from last year. Exports are pegged down only 1.5 million mt. Such a Black Sea surplus implies that fob offers there will range from $180-195/mt into early autumn. This is equivalent to $4.40-4.70, basis spot CME. Major exporters will again have ample surpluses in 2015, which will work against sustained rallies in the US. A test of recent lows is expected during harvest.

10 June 2015

  • The June crop report held little in the way of surprises and markets have closed lower with wheat leading the way lower, CBOT wheat closed around 3.5% lower amid the expanding harvest and improved prospects for needed rains across parts of the EU and Canadian wheat growing areas.
  • Corn and soybeans followed wheat lower and it will now be weather (which will impact supplies) that will drive CBOT prices in the run up to the 30 June stocks and seedings report.
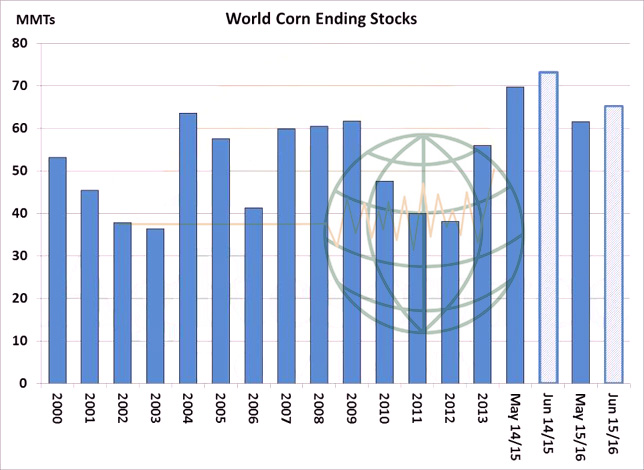
  • One surprise came in the shape of the 5 million mt of 2014/15 corn stocks which were “found” raising stocks to the 2nd highest level on record at 197 million mt. It was in1986 when global corn stocks reached a mammoth 204.8 million mt.
  • It appears that the world is heading for a record combined stockholding of wheat, corn and soybeans in 2015/16 whilst US combined stocks will be heading towards a record level too. As Chinese soybean meal prices continue to hover around eight year lows and they are making little impact in the global market it is hard to forecast higher prices unless we see a severe (and totally unexpected) drought.
  • Wheat looks like a definite “sell”, and it really feels as if nearby soybeans will struggle to hold current price levels on the back of the largest US stocks in some nine years.
  • To download our USDA Recap please click on the link below:

USDA Recap 10 June 15


10 June 2015

  • Canadian Canola futures have rallied to yearly high with a noticeable push seen in the last week. Canola stocks were already tightening amid slightly higher than expected crush and lower expected new crop planting intentions. The EPA’s proposal for higher biodiesel blending, and recent frost/freeze damage have exacerbated the rally. We have adjusted harvested area and yield to levels slightly below the USDA’s forecast in May due to a late May frost. Notice how sensitive Canada’s canola balance becomes for 2015/16! Harvested area is projected at 7.4 million ha, down 300,000 from USDA. Yield is pegged at 1.85 mt/ha, down 4%. Yet stocks will be nearly halved and a supply rationing rally is unfolding. Our adjusted balance sheet features Canadian canola stocks/use of 5.8%, vs. 13% in 14/15 and record low stocks/use of 4.2% in 2012.

  • Our 13.7 million mt production estimate is 6.6 million mt above total domestic use – which is projected to be flat in 14/15 – and this surplus will be declining for a second consecutive year. The market will have to slow exports, and still drawdown ending stocks to a three-year year low. We peg Canadian canola ending stocks at 875,000 mt, down 750,000 from the USDA’s 15/16 forecast and down 1.2 million mt from a year ago. Assuming steady crush and feed disappearance, Canadian canola exports will be capped at 7.9-8.0 million mt, down 1.3 million mt from the peak of 2013. Note also that world canola stocks will be in decline amid the loss of Canadian and EU supply, with global 2015/16 canola stocks/use estimated at 6.2%, vs. 10% in 2013, the lowest total since 2003. The canola balance sheet is an island of supportive vegoil support.

  • The market is already sending the signal for end users to seek alternative vegoil supplies. The graphic below charts US soybeans and Canadian canola prices in US$/mt, and the canola market has develop a premium to soybeans rather quickly. This is far different from what’s been witnessed in the last two years. Spot canola is priced at a $52/mt premium to soybeans, and an even steeper $61/mt for autumn delivery. There’s no shortage of North American or global oilseeds/products, but how it gets distributed will affect inter-commodity spreads. We expect sub-$9.00 soybean futures to weigh on canola, but hefty premiums will be paid for canola over the course of the 2015 marketing year. Stats Can will update Canola acreage on 30 June with initial production due in mid-August.