30 June 2016

  • The USDA has today released its weekly export figures as detailed below:

Wheat: 645,400 mt, which is above estimates of 300,000-600,000 mt.
Corn: 1,004,600 mt, which is within estimates of 1,000,000-1,450,000 mt.
Soybeans: 1,528,000 mt, which is within estimates of 1,100,000-1,600,000 mt.
Soybean Meal: 159,700 mt, which is within estimates of 100,000-275,000 mt.
Soybean Oil: 62,400 mt, which is within estimates of 40,000-70,000 mt.

  • Brussels has issued weekly wheat export certificates totalling 503,710 mt, which brings the season total to 32,94 million mt. This is 86,974 mt (0.26%) ahead of last year.
  • USDA acreage and quarterly stocks data released today was reported as follows:

US all wheat area: 50.816 million acres, above estimates of 49.869, up from 49.559 last quarter and down from 54.644 year on year.
US corn area: 94.148 million acres, above estimates of 92.896, up from 93.601 last quarter and up from 87.999 year on year.
US soybean area: 83.688 million acres, below estimates of 83.834, up from 82.236 last quarter and up from 82.650 year on year.
US wheat quarterly stocks: 981 million bu, just below estimates of 982 million bu, down from 1.372 billion bu last quarter and up from 752 million bu year on year.
US corn quarterly stocks: 4.722 billion bu, above estimates of 4.528 billion bu, down from 7.808 billion bu last quarter and up from 4.453 billion bu year on year.
US soybean quarterly stocks: 870 million bu, above estimates of 829 million bu, down from 1.531 billion bu last quarter and up from 627 million bu year on year.

  • The June report held a few varied surprises such as larger than expected US corn stocks, larger than expected US corn seeding, and a soybean seeding number that did not change the bullish outlook for this market. The soybean/corn ratio pushed out to an historic high of 3.1:1 and the ratio promises to rise even more in the trading days ahead. It appears that the report is bullish soybeans, neutral to bearish wheat, and bearish corn. We expect that the strong soybean market will drag the grains upwards on short covering into the weekend. US soybean futures could score new rally highs. NASS estimated that US corn area expanded to 94.1 Mil acres, up 7% from 2015, and the third largest US corn area since 1944. The US farmer did not shift acres away from corn to soybeans according to the report, US farmers continue to favour the higher yielding corn crop. With a trendline yield of 168.6 bushels/acre, the US will produce a corn crop of 14.6 billion bu. This will push US 2016/17 corn end stocks above 2,300 million bu. US soybean plantings were forecast by NASS at a record high 83.7 million acres, which is up 1% from last year with record high plantings recorded in; MI, MN, NY, ND, OH, PA, WI.
  • Total principle US seeded crops expanded to 323.427 million acres, with expansion across all areas of the Central US, except the Plains and MS. Combined US corn and soybean acres rose 7.187 million acres! The biggest falls in US acres occurred in all wheat at minus 2.923 million acres and sorghum at minus 1.234 million acres. The real surprise was the rise in US hay acres at 1,690 million acres. The rise in US hay acres is likely to keep pressure on US forage prices well into mid 2017. US corn stocks at 4.722 billion bu were 269 million bu larger than last year, up 6%. Much of the corn stocks were held off farm which was up 9% from the prior year with commercial stocks up 3% at 2.25 billion bu. US farmers still have a sizeable cash corn position to sell before the new crop harvest. It is estimated that third quarter corn feed/residual is 992 million bu, which will be down 124 million bu. The US third quarter soybean residual was pegged at minus 80 million bu, double the rate of the past crop year. US June 1st soybean stocks at 870 million bu were up 243 million bu from last year. The larger stocks will help buffer the large export demand that appears forthcoming in August and September. US June 1st wheat stocks at 981 million bu were right at trade estimates and will represent 2015/16 final supplies. 4th quarter US wheat use was projected at 391 million bu or up just 1% from the year prior.
  • Based upon strong export demand for US soybeans, the 2016/17 balance sheet will remain tight. We expect that November soybeans could push to new rally highs with potential to $13.00. On the other side is the oversupplied grain market with corn and wheat prices to try to follow the complex, but without adverse weather, December corn could reach $3.20-3.40 with July Chicago wheat reaching our long held downside price target of $4.00-4.25. The soybean market reconfirmed bullish price trends with US seeded acres that did not exceed 84 million. The bearish surprise was corn via both stocks/seeding with US 2016 corn plantings at their third largest level since 1944. The soy/corn ratio could rise to a record 3.5-3.7:1 as the market tries to buy additional 2017 S American soybean acres.
29 June 2016

  • Caution ahead of the June Stocks and Seedings report, which will be released Thursday, was always likely to be the case, key is US seeding estimates. The average trade estimate is for 2016 US soybean acres is 83.8 million acres which would be a gain of 1.6 million acres from March, while US corn acres slide 700,000 acres to 92.9 million acres. US spring wheat acres are expected to rise 366,000  to 11.7 million acres. Combining corn, soybean, and all wheat, US June 1st crop seeding is expected to rise just 1.17 million acres from March, which we believe is too little when one considers that farm profitability rose by its 2nd largest total on record during the period. We would expect that total US major crop acres will rise at least 3 million acres with the potential for as much as a 4.5 million acre increase. In 2009, the last time that on farm profitability this much, farmers responded and seeded additional acres which produced a bearish June report. In our  view, the trade is underestimating the amount of US crops that were planted, potentially by a significant amount.
  • Unlike the EU model, the midday GFS weather is much cooler for corn pollination following a brief warmup on July 6/7. A strong push of Canadian air would limit any stress on corn with near to above normal rains. The forecast leans bearish on prices with the chant of record US corn yield potential becoming louder. There appears no evidence of any US pattern stagnation into mid July with a replication of the 1983, 1988 and 2012 droughts off the table as 2016 US weather patterns unfold. As such there is no evidence of a dire Midwest drought pattern into mid July, and although there will be a few warm to hot days next week, the big rains that will fall before the heat will limit any crop stress. We lean bearish grain!
  • It was a quieter day of trade in the Chicago soybean complex with markets ending mixed. Soybeans ended moderately weaker, while the meal market pushed to new weekly highs. Bean oil slipped to a 2-3 month lows, while crush spreads jumped up as much as 13 cents in July and 6-9 cents/bu in other months. Quiet overnight trade is likely, with a strong market reaction expected at the midday USDA report release. The soybean acreage number looks to be the most important statistic on the need to replace short S American bushels. We would not be surprised if the spring soybean price rally encouraged as much as an additional 2 million soybean acres.
  • The global wheat balance sheet continues to loosen, cash wheat prices continue to fall, and the weather models are lacking yield threats through the next two weeks. In fact, the details of the 7 day forecast have trended wetter, and a general Ridge/Trough pattern through mid-July will promote additional rain chances over the next two weeks. Corn pollination will be widespread by July 10th. With US cash wheat prices at multi-year lows, and with Black Sea feed wheat falling another $2/mt today, a demand story remains lacking. Consequently, rallies hinge upon supply loss, and the recent change in the forecast will push any real threats into the second half of July. Assuming weather conditions are unchanged in the next 4 to 5 weeks, one can reasonably expect an August yield estimate from NASS just above 170 bushels/acre. The point is that the USDA’s end stocks estimate of 2.0 billion bu appears accurate without damaging weather in July, and research continues to suggest prices of $3.20-3.50, basis December futures at harvest time. June 1 stocks will doubtless trigger market excitement on Thursday and, unlike beans, price won’t be as sensitive to yield changes amid current crop conditions and deteriorating export demand potential.
  • US and world wheat prices fell again, with July Kansas futures settling below $4.00 for the first time since 2006, and yet Gulf HRW maintains a premium to comparable Russian origin into August. Feed lots are reportedly increasing the inclusion of wheat into feed rations, but there’s still no sign of a lasting bottom. Tunisia secured optional origin wheat for Aug/Sep at a fob price of roughly $160/mt, which is a new multi-year low in the global market. This shook quoted offers from Europe and the Black Sea, with Russian origin falling to $174/mt and French dropping to $176-179. These compare to Gulf offers this evening of $185-187, and non-traditional US export demand is unlikely to be found near term. One noted commentator described the tender price as  “shockingly cheap”. The market is working to clear what’s become a massive surplus, which will take time. Stats Can cut Canadian acres modestly, but this will be more than offset by higher yield. A lasting price bottom is on the horizon, but isn’t expected until late Jul/Aug, when more is known about N Hemisphere quality. A sell-the-rally mentality will remain intact through the foreseeable future.
  • Other notable items include the latest estimate for Romanian wheat output to reach a record 8.28 million mt on the back of favourable weather; whilst in isolation not a market changer, it is the “knock-on” effect upon neighbouring regions and their output that is relevant.

28 June 2016

  • Soybeans and meal futures were up sharply in the overnight as Chinese soymeal surged higher on huge volume. Gains in US markets were pared back through the day on profit taking and wetter midday weather forecasts. Ahead of Thursday’s USDA report, the average trade estimate calls for a soybean acreage total of 83.8 million acres versus March intentions of 82.2 million. The average estimate for June 1st soybean stocks is 829 million bushels. Residual is the most difficult line item in the balance sheet to estimate, and the average estimate implies a quarterly residual of -40 million bu (negative). The average estimate appears inline with the historical trend. Strong Chinese meal demand and late season US export demand have been the key drivers of US soybean prices. US Aug/Sep exports will likely be record large, and a sharp jump in acreage is needed to confirm a top in US soy prices.
  • Chicago corn futures settled unchanged for a second consecutive session. Early support was noted from a turnaround in a host of markets (the US$ fell, crude and equities rallied), but Central US drought development is still unlikely through the first half of July. Global milling wheat prices also continue to fall, and new corn US corn demand is being slowed, not accelerated. Midday highlighted how the major weather models are having difficulty with 10-day forecast amid a rather fast moving jet stream. Nearby, there’s agreement on soaking rain across the S and W Corn Belt, which will be a net benefit to national yield. There is currently limited confidence on next week’s pattern, but we should be mindful that there is potential for widespread heat. Near term direction will still largely be a function of daily weather updates, and unlike recent years, the market is not likely to pivot one way or the other on the critical July 4th holiday. Gulf corn’s premium to Black Sea feed wheat remains $20+/mt, and there’s substantial downside risk if weather in the next 3 to 4 weeks is non-threatening. Ample wheat supplies offsetting yield concerns looks likely to limit upside potential.
  • US and world wheat markets continue to drift lower, and fundamental input is more of the same. There’s talk that Canadian crop conditions are on par with 2013 (when yield was a record) and EU and Black Sea cash prices fell another $1/mt, keeping US Gulf premiums to other origins at $5-15/mt into September. As a result, US wheat export sales will slow over the next several weeks. The US forecast is wet across E CO, KS and parts of NE through the next 3 to 4 days. Cumulative rainfall of 1-3” (heavier totals should be only regional in nature) will disrupt harvest progress. A drier pattern resumes next week and KS’s harvest is noticeably ahead of schedule. Elsewhere, conditions remain favourable. Only light or scattered precipitation is projected across W and C Europe through the next 10 days. Russia will be mostly dry. Harvest has started there and should accelerate throughout July. The Canadian vegetation maps continue to suggest well above trend yield potential, the USDA’s current yield forecast in Canada is 3.02 mt/ha, some 15% shy of the record scored in 2013. Ultimately, price needs to find a level that clears the market of excess supply, and we doubt a lasting bottom has been scored. The difficulty moving forward is that, amid currency weakness, there’s still incentive to maintain or boost acreage across the Black Sea, Canada, Australia and Argentina. Even in the US, deferred premiums keep potential new crop revenue above spot prices. Funds are short an estimated 105,000 contracts, and a short term bounce may lie in the offing but lasting rallies are not expected into late 2016.

27 June 2016

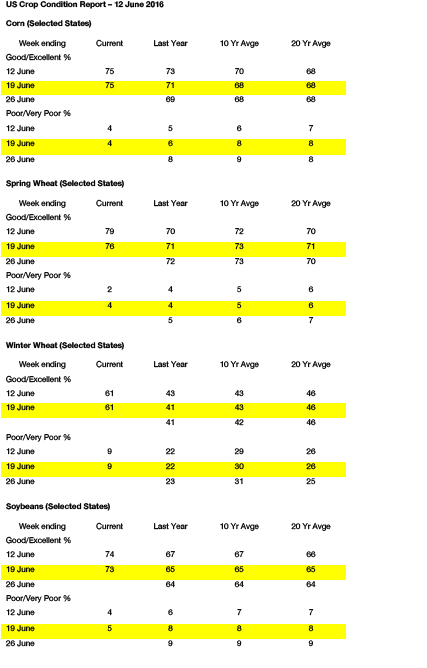
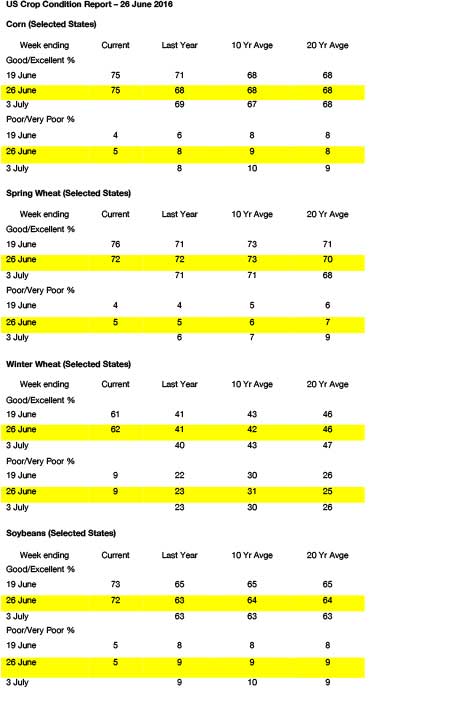
  • Soybeans traded higher overnight, and extended gains through the day on technical buying and new export demand the product markets also both saw good gains. Ahead of the morning open, the USDA’s daily export reporting system showed sales announcements of 132,000 mt of old crop soybeans and 18,000 mt of new crop that were sold to an unknown destination. The sales announcement lifted soybeans at the morning open, and kept prices up through the day. The Crop Progress Report (above) showed an expected, but modest decline in national crop ratings. 72% of the US crop was rated as good/excellent vs. 73% last week. IN and OH crops improved on better rains, while conditions in IA and IL turned down as crops in the Southern and Western parts of each state need rain. Despite the decline, the overall condition of the US crop is still one of the best on record. Ahead of Thursday’s reports, we expect profit taking on further strength, with the market to then trade off the report numbers. Like last year, the acreage figure will likely be more important than stocks.
  • Support was noted early, but the GFS, EU and Canadian weather models added rainfall to the Midwest next week and beyond. Wheat’s discount to corn also continues to narrow, cutting off potential export demand, and crop conditions remain rather lofty. As of Sunday, 75% of the crop was rated as good/excellent, unchanged on the week and compared to 68% a year ago. Rating declines are noted in IL, MO, ND and TN; improvement is noted in IN, MN and OH, and all states report good/excellent above 63%. It’s tough to find a major argument against the USDA’s national yield (168 bushels/acre), and some yield models indicates a potential range of 168-172. July weather is key, but we’ve highlighted that overall US pattern is not indicative of drought expanding in the next two weeks. In fact, abnormal dryness should ease across MO and Delta/Southeast this week. The crop is 6% silking nationally, including 14% in ND. Cash wheat prices across the W Plains are now quoted up to $.30/bu below corn. Black Sea feed wheat is offered today at $164/mt, down $10 from last week and compared to US Gulf corn $185. The wheat market’s need to clear burdensome supplies will weigh on US and global corn demand in 2016/17. At this time we do not expect to see weather driven rallies sustained.
  • The lingering effect of Brexit continues to impact world currencies, and as such EU, Black Sea and US markets begin the week lower, and despite higher projected consumption, Black Sea feed wheat has fallen $10/mt from a week ago, and increasingly it appears the wheat needs to find a level that clears the market of excess supply. US spring wheat good/excellent ratings fell to 72%, vs. 76% last week and unchanged on last year. Winter wheat conditions were boosted 1% to 62%. Harvest progress through Sunday reached 45% complete, vs. 41% last year. The market, KC especially, has reached its initial downside target, though US wheat still isn’t cheap in the world market. EU/Black Sea markets have turned lower ahead of harvest, and in our opinion, additional price downside remains. Quality will be debated throughout harvest, but overwhelming quantities will weigh on grain markets until the next weather threat emerges. Note the normal precipitation is offered to Volga & Siberian Russia (spring wheat) through mid-July. La Niña will be established in some capacity by late summer, which will keep Australian crops well watered. Short covering rallies initiated by fund buying appear unsustainable at this time, and we do not see a longer term bottom until late Jul/Aug.

24 June 2016

  • Chicago soybean markets were lower overnight and liquidation continued through the day. Fundamental news flow leaned supportive on fresh export demand, though the markets followed the rest of the financial markets lower.   Market focus next week will be on the USDA reports, with initial support noted at the 50-day moving average, near $10.60. US old crop soybean demand remains solid.
  • Corn fell, as expected, following Britain’s vote to exit the EU. Some buying was noted towards the close, but US weather and falling non-US grain prices still lean bearish. Unlike a week ago, US forecasts into the first week of July look rather cool/wet, and though crop conditions are likely to fall modestly on Monday, improvement is expected thereafter. Above trend potential remains intact. Recall that weather in July is vastly more important than conditions in June, and the market will continue to ebb and flow on daily weather model releases. Yield models will maintain elevated potential (168-170) through the weeks ahead, should the forecast verify, but the point is that, despite the recent break, volatility will continue over the next 2-3 weeks. Temperatures will be key. Longer term research continues to centre on demand. Even at $3.85/bu, basis spot, US corn is still expensive relative to global feed/milling wheat, as well as Argentine corn, which should continue to fall as harvest expands in July. Gulf corn is one of the more expensive grains in the world currently and weather based rallies will only further ration export demand. Additional downside risk exists without adverse weather.
  • Britain’s surprise decision to exit the Euro Zone rallied the US$ (and weighed on other currencies), but also the market continues to struggle in the face of expanding harvest and rising world production estimates. There are lots of unknowns surrounding the consequences of Brexit, but key is that US$ will likely remain supported. At current prices, Russian exporter revenue is up 11% on last year; US exporter revenue is down 10%. The US can not compete nor is there any incentive for US exporters to become more aggressive. Russian domestic prices also fell sharply this week as harvest in S Russia begins. Test weights have been lower than desired, but yields have been impressive, much like across the US Plains. Quantity remains bearish, but how major milling wheat importers work out quality is less certain, although we would remind that the N Hemisphere harvest is still in its early stages. The market is nearing initial downside targets Rallies will likely to continue to struggle amid favourable Canadian weather, projected weakness in EU/Black Sea currencies, and as exporters become more aggressive when major importer demand finally surfaces.
  • Our weekly fund position charts can be downloaded by clicking on the link below:

Fund positions

24 June 2016

  • Post “Brexit” update:
  • The UK has voted to exit the EU which has produced acute selling pressure across the financial landscape, including Chicago grains. In a vote of 51.9% to 48.1%, the UK will negotiate their independence and exit from the remaining 27 member EU Block. Excessive bureaucracy, immigration and the reestablishment of their borders appear to the main points why Britains voted to leave the EU. Prime Minister David Cameron has offered his resignation this morning. £Stg has fallen to 30 year lows against the US$, while the US stock market had fallen by 700 points overnight. EU equity markets were down 4-7% with some recovery noted in afternoon trade. World Central Banks have promised to offer plenty of liquidity and with the upcoming Brexit process to take years, some bottom pickers are emerging amid the carnage. The US/world grain markets should not, ultimately, be affected by the UK exit, except that the US$ is sharply higher and fund managers are holding a near record long position in summer row crop futures. Chicago corn prices have fallen 60 cents on the week with most of the break via weather. Chicago July soybeans are off 47 cents while July Chicago wheat is off 33 cents, and at new contract lows.
  • The grain question of the day is will the funds unwind an even larger share of their net long corn and soybean position? December corn has fallen below its 100 day moving average while the 50 and 100 day moving averages in soybeans are well below current prices. However, an unpredictable key USDA report looms for next Thursday which promises to have a big impact on the marketplace. Amid the lashing in other financial markets, funds may be quicker to cut their losses. Although some will point to the Brexit vote, the big reason for this week’s Chicago decline lies in improved Central US weather. Some nice rains have fallen across 65% of the Midwest with any searing heat to be located over the SW US into July 7th. This means that the early corn pollination period will be favourable with rains slated for the C Plains and the dry areas of the Midwest next week. We would look for steady/2% decline in US corn/soybean good/excellent conditions on Monday  which argues for a 2016 US corn yield of trendline or above. It’s clear that the current Midwest weather pattern does not mimic any of the prior Midwest drought years of 1983, 1988 or 2012. The US climate still holds some of the lingering signatures of El Niño such as a strong jet stream and abundance of upper air humidity. In other world grain markets, China’s Dalian corn fell 6 cent/bu with January futures at $6.01. Dalian Sept soymeal prices fell $5.00/mt. Paris wheat futures are up €0.50 to €159.50/mt on the acute €uro weakness. However, amid favourable US and world weather, we do look to be a seller of Chicago rallies as funds are still laden with considerable market length. We expect a rather normal summer Midwest weather pattern into July 10th.

23 June 2016

  • The USDA has today released its weekly export figures as detailed below:

Wheat: 465,300 mt, which is within estimates of 400,000-600,000 mt.
Corn: 1,421,000 mt, which is above estimates of 950,000-1,400,000 mt.
Soybeans: 1,322,100 mt, which is within estimates of 1,000,000-1,500,000 mt.
Soybean Meal: 186,600 mt, which is within estimates of 150,000-370,000 mt.
Soybean Oil: 17,600 mt, which is below estimates of 20,000-50,000 mt.

  • Brussels has issued weekly wheat export certificates totalling 585,153 mt, which brings the season total to 32.435 million mt. This is 46,541 mt (0.14%) behind last year.
  • Early strength in soybeans gave way to weaker soymeal prices and soybeans were in the red by the close on Thursday. Old crop meal again marked a new low for the month, while new crop December slipped to a three week low. Soybean export sales were within expectations at 660,690 million mt, taking annual commitments to 49.9 million. Export commitments are now at 105% of the USDA forecast, and just under last year’s record. Given recent sales announcements, commitments will again swell next week, and the USDA will likely increase their annual estimate in the July WASDE. The Argentine AgMin lifted their soybean crop estimate to 58 million mt while the BAGE held their estimate steady at 56 million. Regardless of the actual output, fob offers suggest that exportable supplies are nearly sold out. November beans have easily traded through support at $11.20, with the next target at the May WASDE report high at $10.80 and then the 50-day moving average near $10.60. Confirmation of another 2-4 million soybean acres could produce a deeper correction to $10-10.40, unless weather intervenes.
  • Chicago corn futures fell another 5-6 cents as recently added long positions were unwound. On the week corn is down 50 cents! This is the largest weekly decline since the summer of 2013. Weakness in world wheat cash market (recall the wheat’s bearish seasonal is just starting), and the potential for above-trend yields has produced a dramatic change in market sentiment. A week ago, demand rationing was being discussed; today the market is searching for demand.  US export sales through June 16th totaled 34 million bu, down 1 million from last week and down 25 million from early June. As US Gulf corn’s discount narrowed vs. other origins, sales slowed, and Gulf corn is now priced above EU/Black Sea milling wheat as well as Argentine corn for Aug/Sep. Argentine crop estimates are rising as more of the crop is gathered. A further slowdown in US corn exports is anticipated. Corn has now all but confirmed a seasonal high and the trade no longer expects that the summer of 2016 Midwest weather will mirror the drought years of 1983, 1988, or 2012. Selling rallies appears to be the order of the day right now.
  • US wheat futures continue to reel from improving US weather ahead of corn pollination. Wheat already was looking for better US feed consumption, and the drop in corn futures and cash prices will make this chore more difficult through the first half of the crop year. Global cash prices fell again, Argentine wheat planting has reached 46% complete, and will expand rapidly with soybean harvest winding down, and still there’s a noticeable lack of interest from major importers. US export sales through the week ending June 16th totaled 17 million bu, down 11 million from the previous week and slightly above the pace needed to meet the USDA’s forecast. The pace of sales is likely to slow as more of the N Hemisphere’s wheat crop is harvested in July and August. Russian hi-protein wheat for Aug/Sep delivery is down to $178-179/mt, French soft wheat is offered at $184-186/mt, down $1 from Wed. Following today’s break, US Gulf wheat is quoted at $193-195/mt for August and beyond. Any lasting rallies hinge solely upon heat/dryness in July, which is now looking unlikely.
  • Friday’s trade will doubtless be macro driven on the back of the Brexit vote and all that it implies. The FTSE 100 index has dropped 611 points (9.6%) overnight and £Stg is 1.3233 vs.US$ down from 1.5007 last night (12% down), a level not seen since 1985. Markets are set for a day to equal or even beat the infamous Black Wednesday and Lehman Bros crisis. Fasten your seat belt and hang on – it’s bound to get wild!

22 June 2016

  • Dalian soybean meal prices have soared since the closing days of March on surging hog profitability and short bought end users expecting cheap S American soybean offers. The initial rally sparked record large volume has recently been in decline. The market is technically starting to look rather toppy with a push to new highs needed next week to maintain the upside momentum. Curtailed 2016 S American soybean production is behind the Chinese soymeal rally. China’s hog herd is only slowly expanding, due to environmental issues, even amid record feeding margins. It’s not a surge in snouts that’s rallying Chinese meal demand, but rather an expansion in the supply pipeline that had become depleted via a pervasive bearish meantaility. A top is likely forming unless Chinese or Central US weather worsens.

  • Soybeans bounced on technical buying and rumors of both old and new crop exports to China. November caught support just above $11, where at the low of the day was nearly $.83 under last week’s high. The product markets were mixed, with old crop. Brazilian soybean basis has been over the US since March, while Argentina has been at or above (last week) the US. Any additional world demand will likely be directed towards the US from here forward. The USDA Quarterly Stocks and Acreage reports are a week away, with just one trading day between the report and the long holiday weekend. Independence Day has proven to be a critical pivot point in weather markets, but ahead of the USDA reports, November soybeans are likely trapped in a broad range of $10.75-11.50. The June soybean seeding data has often confounded and caught out even the most astute trader.
  • Corn continues to struggle as rain moves across the E Midwest and S American basis levels are in fast retreat. Lower Argentine fob basis and reducing Brazilian domestic prices as harvest advances should see overall S American prices  fall further in the next 3-6 weeks. Export competition is now well and truly back for the US into early 2017. Note also that China has so far sold 8.8 million mt of its corn reserve stocks into the domestic market with auction prices in decline. Heavy rains will linger across the E Midwest through Thursday and a series of weak systems are forecast to follow next week. Uncertainty over totals and coverage persists, but a broad Ridge/Trough pattern through the next 10 – 12 days will boost rain chances and maintain seasonal temperatures. Pollination begins across the S Midwest next week and yield potential remains high. As we have said previously, June weather does not correlate with yield. Tuesday was important for corn’s chart pattern, and substantial damage has been done. Additional long liquidation is expected without adverse weather in early July.
  • In wheat short covering was noted early, but US futures and global cash prices ended little changed following Tuesday’s decline. US weekly export sales on Thursday are expected in a range of 400-600,000 MTs, but otherwise fresh news is lacking. The USDA did update its vegetation health maps for all major producing countries this morning. Of note, ratings deteriorated further across Central Europe, and the USDA’s yield forecast may be overstated, but elsewhere conditions remain well above normal and last year. The N American weather pattern maintains above normal precipitation and near/above normal temps across the Canadian Prairies, ND and MN through early July. There’s still no sign of an Egypt’s first new crop tender, and now fraud has been attached to its domestic purchases this spring. Political/economic turmoil has weighed on N Africa/mid-East wheat import demand. A period of consolidation may lie ahead until EU quality can be assessed, but we maintain a bearish outlook on rallies. It remains that the US only competes for world trade below $4.50, basis Sep Chicago futures.
  • Our  latest thoughts on the wheat situaion in Russia can be downloaded by clicking on the link below:

 Russian wheat S&D

21 June 2016

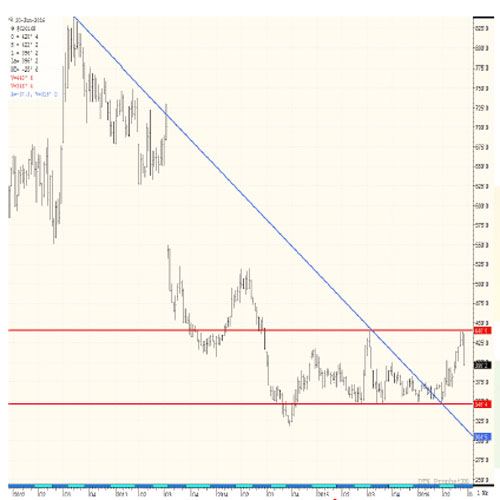
  • The chart below reflects that spot Chicago corn futures have held the upper end of a trading range of $4.40/bu (despite the forecast of a 1983 type of Midwest drought by many private forecasters). July Chicago corn rallied on Friday to the $4.40/bu high scored last June and has quickly retreated with futures limit or near limit down today (Tuesday). The sharp corn price drop strongly suggests that a seasonal high has been scored with funds holding a sizeable net long corn position. The next downside price target for spot corn is the $3.50 the lows scored in March. If spot corn futures were able to drop below $3.50, the next downside target is $3.20 – the 2014 low. Of course, if July corn were to take out Friday’s high the next target is the gap at $5.50. Weather, weather and more weather will be the driver!

  • Favourable weather forecasts and crop ratings keep soybeans under pressure in Chicago. Prices turned lower in overnight trade and the pace of liquidation quickly increased as the morning opening. Despite some building heat in coming weeks, the crop looks as if it will receive good and welcome rains in the next 5-7 days. Monday’s NASS Crop Progress report expectedly showed a decline in subsoil moisture ratings, and as with crop ratings, a decline in subsoil ratings is typical as the summer progresses. here is relief coming, with drier areas to see good rains later this week. November soybeans closed just above last week’s low, with the next level of support noted at $10.80/bu. China has unsurprisingly showed up as a regular buyer of both old and new crop beans, which should underpin the market on a further correction, and they continue to ready an auction to sell reserve soybeans.
  • Corn prices fell sharply as weather forecasts remain non-threatening into July, and the market settled limit down on the cooler and drier conditions.  We also focus on demand potential (as we have so often said!), with global feed wheat cash prices trending weaker and still offered at a substantial discount to Gulf corn.As some stage this has to become a price pressure point for corn. Two months ago US Gulf corn was the world’s cheapest feedgrain, offered at a discount of $2/mt to feed wheat and $1-10/mt to S American and Black Sea corn. Today, however, Gulf corn is one of the more expensive grains. Black Sea feed wheat for Aug/Sep is offered $173/mt, vs. Gulf corn at $188. Argentine corn is now quoted $.08-.15/bu below US, and Ukrainian corn is the world’s cheapest corn for Oct and beyond. The window for US corn exports is rapidly closing and buyers are taking note. Fund liquidation was evident, and if current weather forecasts are extended forward we will likely see further substantial liquidation from the recent, close to record, net long positions held by the funds. Technically we believe Chicago and global fob corn prices have forged a seasonal “top”. Some research is suggesting a US yield of 173 bushels/acre, but it remains early days and despite the US corn crop looking good, and withstanding the warm and dry June conditions, we would remind that June weather and final corn yield correlates very poorly!
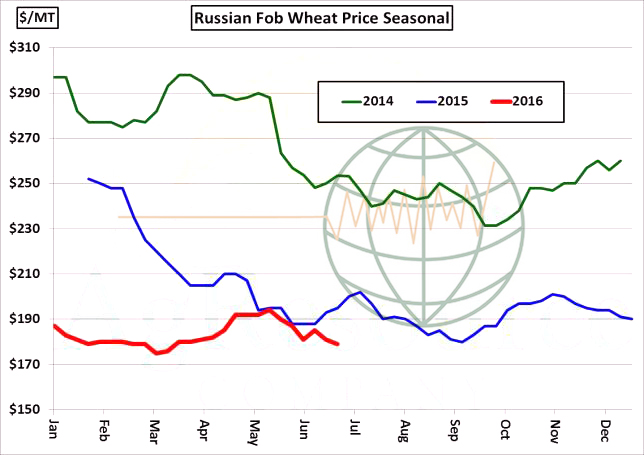
  • Wheat prices hit and/or neared contract lows on the back of weaker corn and weaker global cash markets. Kansas wheat made new lows whilst Chicago (Sep ’16) came within 8 cents of its May low. The markets biggest job right now is to work lower in order to alleviate the burdensomely high US and global stock levels via increased feed offtake, and trend yields and falling corn prices make this more difficult to achieve. EU and Black Sea wheat cash prices fell $1-2/mt, and Russia is still the world’s cheapest origin at $179-180/mt for Aug/Sep. Assuming current Gulf basis, this is equivalent to $4.30, basis Sep Chicago; however, the graphic below (as well as Russia’s expanding crop size) suggests further downside risk exists in global cash markets. We also note that Egypt appears ready to relax its standards on ergot, and so its first new crop tender may be forthcoming. This will be important in determining an actual trend in world prices. We fully expects exporters to be very aggressive!

20 June 2016


  • Funds might well be back (as of last Tuesday – latest data) holding their largest net long positions in corn, soybeans and wheat since the middle of 2014, which given good weather so far in the N Hemisphere suggests that they remain in the situation of almost demanding an adverse weather issue if the Chicago rally is to remain in situ.
  • Soybean futures started the week lower on a wetter weather forecast, which ultimately left them, and products (meal and oil) lower at the close. Rain chances across the corn belt (oddly named as it includes huge swathes of soybeans as well) were predicted this coming week, especially in the drier parts of the east where last week saw a fall in crop ratings. Overall, it has to be remembered that the US soybean crop condition is well above average and one of the best rated in recent history! Does it justify current pricing? A price break lower feels unlikely until such time as we know more about summer weather patterns.
  • Corn markets were easier as weather premium eroded on improved weather forecasts and their widespread rainfall prospects. It is important that the rain falls, not just for the crop but also for prices, as soil moisture levels in the eastern midwest are in sharp decline. Crop condition remains good, and it should be noted that we are 4% above last year (good/excellent), and just 1% shy of this week in 2014 when record yields were set! As with soybeans does this justify current pricing? Again, as with soybeans, we need to see what the remainder of the summer weather pattern brings!
  • Wheat in Chicago also fell in line with corn as well as the proximity of the N Hemisphere harvest. Unlike corn, US wheat has to build a demand story, and the most likely route seems to be via livestock feeding rather than already price pressured exports. In Russia it seems interior cash prices are at a peak with harvest just around the corner and private forecasters edging their output estimates still higher. Some are talking of 65-66 million mt, which would simply add to global end stocks and from this perspective it does not feel that we have yet seen the market bottom.
  • The fears of a British vote to exit the EU appear to be on the wane and £Stg rallied strongly as a consequence. The impact for London wheat vs. its MATIF counterpart was evident. Doubtless the market will retain some concerns until the result is announced in the early hours of Friday morning, UK time.