31 July 2015

  • Last night’s soybean and wheat exports sales were better than expected, and improved on recent weeks. But broadly, 2015/16 sales remain well behind recent years, and in fact, the discrepancy between last year and this year is growing. Total corn, wheat, soybean and meal commitments for the 2015/16 crop year stand at 21.6 million mt, down 41% from last year. A week ago this discrepancy was 40%. This is due to large corn and soybean purchases in the same week last year, and generally, new crop soybean sales in July of 2014 ranged from 1.0-1.3 million mt per week, vs. 200-900,000 mt this year. We are concerned that S American soybean/corn exports are cutting into the US’s window of opportunity, with China already booking 6-7 million mt of S American soybeans for Sep-Oct-Nov delivery. US export demand is fading on expensive Gulf fob offers.

  • Russian wheat prices have fallen to test spring lows. This is behind the decline in US and European wheat futures, and even amid cheap prices, Black Sea exporters are struggling to find new business and Russia’s export tariff uncertainty has caused the market to be mostly one of hand-to-mouth buying, as evidenced by recent Egyptian tender results. Wheat yield estimates from Southern and Central Russia continue to surprise to the upside, and weather across the Volga and Siberian regions (where spring wheat is grown) has been favorable in July. Normal precipitation and temperatures are projected across Siberia and other spring wheat areas in Russia for the next two weeks. It seems prudent to raise our Russian all-wheat production forecast to 58.7 million mt, up 1.7 million mt from the USDA’s estimate in the July WASDE. Exports, too, will likely be raised on greater supplies.

  • We would wish to highlight the importance of Russian supply, demand and price for the world market, and it’s well known that Russian fob offers are a benchmark for other markets in summer and early autumn. Russian prices, in turn, are largely a function of their exportable surplus. The graphic below illustrates the correlation between domestic prices and ending stocks as a percent of domestic use. Russia has held bigger surpluses in the past, but the plunge in the Russian Ruble has limited any fob price rally. The low so far in domestic markets rests at 8,900 Rubles/mt, which is above the 7,750 Ruble price projected by the model, with stocks/domestic use pegged at 16%. However, we fear additional losses in Russian prices are in the offing as spring wheat harvest nears. About 50% of Russia’s wheat crop is winter and 50% is spring. Even current domestic prices at 9,000-9,500 Ru/mt are equivalent to $4.10-4.50/bu and Russian fob offers will remain the world’s cheapest in the foreseeable future.

  • Despite being seemingly cheap at $4.10-4.50/bu, Russian prices in Rubles are up 40% from last year’s harvest lows. Producers will receive more revenue this year and with planting decisions to be made in the next 2-3 weeks, we expect expanded winter seeding for 2016. The graphic below charts the Ruble as well as spot CME wheat futures prices in Rubles since 2005. In Rubles, domestic Russian wheat prices hit an all-time high in late 2014.And they are perched near multi-year highs today. There’s little doubt that this will incentivise Russian producers to expand acreage in 2016. Assuming trend yield, another Russian harvest of 56-62 million mt can be expected in 2016, with exports ranging from 22-25 million mt. Currency has become a very important consideration in any long term supply outlook in world wheat. US wheat exports will suffer as a result.

  • As an aside, the North Dakota wheat tour has ended, with spring yield estimated at 49.9 bushels/acre, a record for the tour. The durum yield estimated at 39.2 bushels/acre, not a record but up 2.6 bushels/acre on last year. Harvest lies just ahead. US export sales through the week ending July 23rd totalled 25.7 million bu, a marketing year high, with improved interest for HRW and HRS. Only traditional destinations are noted, but the week’s business is modestly above the pace needed to hit the USDA’s target. However, we doubt that the pace can be sustained amid ongoing discounts in Europe and the Black Sea. The Aussie forecast has eliminated rainfall in Eastern areas, which warrants monitoring amid a still-developing El Nino. Otherwise, we advise a more neutral outlook into August as Black Sea prices have stabilised – and the quantity of high quality Russian milling wheat is still being debated. However, sub-$5.00 futures will need to be sustained to attract better US exports, and generally more work needs to be done to encourage higher total consumption.

30 July 2015

  • The USDA has today released its weekly export figures as detailed below:

Wheat: 700,400 mt, which is above estimates of 400,000-600,000 mt.
Corn: 808,200 mt, which is above estimates of 350,000-800,000 mt.
Soybeans: 1,315,800 mt, which is above estimates of 800,000-1,100,000 mt.
Soybean Meal: 151,800 mt, which is within estimates of 50,000-200,000 mt.
Soybean Oil: 74,800 mt, which is above estimates of 10,000-55,000 mt.

  • Brussels has issued weekly wheat export certificates amounting to  339,566 mt, which brings the season total to 1,655,262 mt. The season to date total is 807,738 mt (95.31%) ahead of last year.
  • Today has seen a steadier market in Chicago with corn, wheat and soybeans all having traded in positive territory although the last hour of trade is beginning to show the grains easing back a touch to around unchanged. End user pricing ahead of the August delivery period in soybean and meal appears to have been the main soy complex driver today. Funds have made an effort at new longs, whether that is an attempt to justify some of their long and wrong positions remains to be seen.
  • US export sales (see above) were somewhat better than expected, particularly in soybean and wheat, and this has lent some support to prices today. The figures included a net 15 million bu of old crop soybeans including a surprise 11 million bu to China, which is not expected to be shipped, and may indeed be an error according to some reports. New crop sales improved to 33 million bu. Wheat sales reached 25.7 million bu with renewed interest in hard red winter and spring grains. Old crop corn sales totalled 14.4 million bu with new crop reaching 17.5 million bu, neither figure being particularly inspiring! One thing remains abundantly clear, and that is that US new crop export sales are well below those of a year ago.
  • In Europe, Matif wheat ended higher on a weaker €uro although cash premiums were pretty much unchanged. The EU export pace (see above) would suggest an annual figure in the region of 22 million mt, which is too low but overall demand (as we have stated ad nauseam) is clearly down at present. There will also likely be less for export based upon the suggested increase in feed wheat consumption. It seems that there is, and will be, more feed wheat supplies across the Ukraine to Bulgaria region than last year, and also more than originally anticipated. However, N France is without doubt experiencing a wheat protein deficit, and this may well find a feed home. Given last year’s EU corn crop plus imports of 85 million mt would result in a like for like import figure of 25 million mt basis the anticipated 60 million mt crop. To avoid a 25 million mt corn import figure it is becoming more and more likely that Europe will feed more wheat (and barley where possible) and reduce corn imports year on year. This will result in reduced EU wheat exports, and our current thinking is that we will see a figure closer to 25 million mt rather than the USDA’s current 31 million mt estimate.

CHINA IS SLOWING DOWN…..

  • It’s an issue observers have talked about for years. But over the last week or so, it seems to have reached a tipping point – at least according to general consensus from a cacophony of commentators. China is slowing down. Its stock market has fallen sharply since mid-June and the government is panicking, leaping into action with a host of supportive measures like closing some share trading for upwards of 6 months.
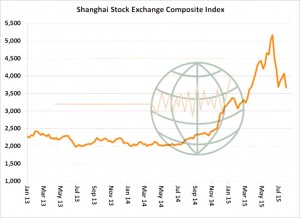
  • The Government halting trading is unprecedented, and would never occur in a more free market-oriented economy. Moreover, China has lowered its lending rate four times since the start of the year and cut their reserve requirements in an effort to boost the economy. Despite all the drama, the actual drop in the Shanghai composite does not have a significant wealth impact on all of China. Nevertheless, the concern is that near-emergency measures offered by the Chinese Government may be seen as a signal that the Government is no longer able to manage GDP growth. The concern is that Chinese debt has risen to unsustainable levels, offering new risk to China, which has been trying to shift its economy from one based on exports to one led by consumption.
  • China has roughly had 1.3 billion people since they installed their “1 child policy” in the early 1970s. The world agricultural community has been counting on China’s huge population to be the saviour of agriculture. However, it was not until the early 2000′s that China became a WTO member and a significant importer of a host of commodities – including energy, ags and metals. This growth in Chinese import demand correlates with China’s rapid increase in GDP rates beginning in 2001/2002. When China’s GDP rates went from $1,000 per person to nearly $8,000 today, China’s demand for soybeans and a host of other commodities exploded. The question going forward is whether China’s soaring per-person GDP rates can be sustained for the next five years. This is the issue everyone involved with global commodity markets should be looking at very closely.

  • The IMF, in its latest outlook, projects a decline in the rate of growth of China’s total GDP and in per-capita GDP in the coming years. Per-capita GDP is projected to increase 7.5% in 2015 and just over 6% in 2016. Growth will still occur, but this is notable change from annual boosts in income of 10-30% seen since the early 2000s. Declining marginal economic growth, coupled with farm policies that encourage production – but also imports – has triggered a huge surplus of commodities in China, most notably in wheat and feedgrains. Chinese corn and soymeal futures – solid agricultural indicators – have been in retreat in recent months, with corn having plunged some 20% since early May. China’s growing appetite for meat during its unprecedented rise has been a boon to global grain and oilseed markets, most notably soybeans. In recent years, strong Chinese import demand for soybeans has been the only thing (or certainly the main thing) supporting and driving prices higher. However, discouraging signals are starting to appear. According to the Chinese National Bureau of Statistics, pork production in the country fell by 5% in the first 6 months of 2015.
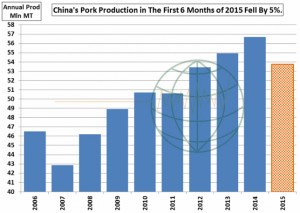
  • The classic assertion that as per-capita income continues to grow (albeit at a slower pace) and more people come to urban areas, meat consumption will increase likely still holds true in the case of China. The 5% decrease in pork production perhaps clouds the larger picture, as some of the decrease can be attributed to natural losses in the pork sector and even a government-led crack down on the Chinese tradition of wasteful over-consumption at banquets. Pork prices have recovered recently, and we very well may see a recovery in pork production and consumption over the next 6 to 18 months. Still, the unsustainable growth of recent years, along with simply too much supply, has triggered questions surrounding China’s demand for raw materials over the next 1-2 years. One thesis since 2012 has been that adverse weather or much improved Chinese demand is needed to sustain any lasting agricultural commodity rally. Weather, of course, is unknown, but increasingly it looks like China will not be a driving factor in 2015 or 2016.

30 July 2015

  • The industry is still clamouring about last week’s rise in US corn net long fund position at a time when corn prices fell $.40. As most know, fund activities do not always correlate with price – but as the graphic below suggests, there has been a massive shift in corn ownership from the farmer and commercials to the funds. The wet weather rally from mid-June into early July allowed farmers the chance to sell old crop cash corn profitably – and to hopefully sell additional new crop supply. Whether the CFTC makes a correction to Commitment of Traders data in this week’s report, as some bulls argue, is unknown. But, funds will still have considerable market length to shed as corn seasonal price trends turn lower in August. Our “back of a fag packet” calculation estimates that funds are still long at least 200,000 contracts! This leaves some room for movement……

  • The soon-to-be-deliverable August soybean and soybean meal futures offered short covering support in yesterday’s trade. Funds were on the buy side of the market with the cash market offering early support. US farmers are tight holders of any remaining old crop supply, but cash basis levels are well below of levels of recent years. Old-crop soybean futures rose 3-8 cents while new-crop futures were unchanged to down 2 cents. Funds were reported to have bought 2,000 contracts of soybean meal, sold 5,000 soybean oil, and were even on soybeans. The chart below shows weekly Argentine farmer soybean sales relative to the seasonal for total Argentine crush and exports. Total sales are 36.7 million mt, up from last year’s 27.8 million mt and the 2nd highest on record. The pace of farmer sales is more than 3 standard deviations above what is expected based on the USDA’s projections. In particular, the USDA is projecting exports of just 8 million mt. However, at this pace, Argentine exports could match or exceed the record 13.7 million mt (503 million bu) that was shipped in 2009/10.


29 July 2015

  • Today has seen the funds as sellers of grains with CBOT wheat shedding close to 3% and corn around 2% whilst soybeans have made modest gains. Slow US and world export demand is clearly pressuring grains whilst the soybean complex has caught a bid on short covering ahead of the soon to be deliverable August contact. There has been a noticeable absence of US farmer selling, but as the Louisiana soybean harvest s expected to commence by mid-August neither crushers or exporters appear unduly concerned over tight supplies as was the case a year ago.
  • Black Sea wheat sellers appear to be having a rough time finding fresh demand, Russian export pace looks to be around 30-40% of last year for July/August, which suggests that volume exports will be pushed forward to deferred positions. If Russia is to reach annual tonnage export projections there needs to be a much more aggressive approach to sales in the immediate term. The Russian crop appears to be growing by the day based upon reported yields and we look for new lows in Russian fob offers.

29 July 2015

  • The chart below illustrates the advantage that the declining value of the Real is offering to Brazilian farmers – and why their 2015/16 soybean acres are likely to rise another 3-5% to a new record high. Although CBOT soybean futures are off 6% since the start of 2015, the Brazilian Real has declined MORE than 30%, which at $10.00 soybean futures has added an equivalent of $3/bu to Brazilian farm income. Brazilian farmers will start soybean seeding in about six weeks and they are cheering (equivalent) $13 soybeans! This is an economic saga for the US farmer since he/she is struggling with at or below breakeven prices and he hopes that others cut their production. The rising US$ is enhancing foreign grain and soybean production to the chagrin of the US producer. He/she is the one that will have to either cut inputs or seeded acres.

  • Yesterday saw soybeans rally (as anticipated) from Monday’s price onslaught! Since the July 14th price high, a mere two weeks ago, November futures have fallen $1.13/bu, or roughly 11%. The market is within 35 cents of the contract lows and the debate remains as to how many, or how few, soybean acres were not seeded in 2015, and the inevitable impact upon overall output. Recall that NASS has resurveyed planted acreage in some states, albeit too late for the July WASDE report, but this should percolate through into their August release and potentially produce a positive report! With mostly adequate soil moisture levels it will be Central US temperatures that will be most important to US soybean yields this year. Current forecasts call far near to below normal temperatures from late this week, and this will favour podding and pod filling. Forecasts into mid-August again lean favourable for yield and trendline levels should not (yet) be written off. Farmer selling has declined in the recent price fall but cash basis has firmed accordingly. Further rallies will likely see improved farmer selling, which will cap upside. Additionally, we should not forget that Chinese demand for US soybeans is, at best lacklustre, through to November and even December. Accordingly we are more wedded to our view that season highs are in place.
  • In corn we also saw a “Turnaround Tuesday” following the market’s two day price lashing, although a three cent turnaround does not appear to be too convincing! Fresh market news is sadly lacking! Argentine fob premiums remain some 40 cents below US Gulf and Brazilian export commitments are growing, both adversely impacting US opportunity. US weather is favourable, and some 25-30% of the crop is in dough stage by the end of this week. Forecasts are consistent with a good mix of light to moderate precipitation and sunshine – all conducive to crop development. Modest crop rating improvements are anticipated in the next few weeks. China is experiencing huge difficulty in selling off its sizeable state reserves into its domestic market with a suggestion that only 3.4 million mt have been successfully auctioned out of an estimated 150 million mt stockpile. Chinese prices have declined around 20% since late May. We suspect that there could well be further liquidation into the week and month end, and if US national yield reaches 164-167 bushels/acre ten “fair value” would appear to be in the $3.60-$4.00 (basis December futures) range. Rallies look a fair bet to sell into right now.
  • Chicago wheat markets gained 3-9 cents with Chicago outpacing the premium Minneapolis contract. The Wheat Quality Council, who have been conducting a crop tour in the N Plains, have placed some ND yields at or above last year. In Russia the Rouble has fallen to a 20 week low with planting decisions to be made in a few short weeks. The Rouble vs. US$ has fallen 20% since early May and is hovering just above the January lows. The impact is that the July 2016 contract price in Roubles stands at 11,800/mt compared with 7,000/mt exactly 12 months ago! Clearly the likelihood of reduced planted acres is looking remote! This perhaps exemplifies just how critical currencies are to non-US exports and non-US seeding intentions. Aussie weather forecasts are calling for heavy showers across W Australia, which will go a long way to replenish soil moisture ahead of the critical growth phase that starts in August. Overall, wheat has seen a bounce from its technically oversold condition and as downside targets have been met (for now) we would continue to look at further rallies as a selling opportunity.

28 July 2015

  • We provided an initial comment earlier today, so a brief update follows. Today’s volume in Chicago is much reduced on yesterday where we saw some big price declines, and today has seen some recovery in soybeans and wheat with corn a touch lower (with under half an hour to go). Market length is still being taken out of corn and there was evidence of short covering in soybean and wheat, which would explain today’s moves to a large extent. Unless we can see markets close on their highs it feels as if we will continue to see prices pressured lower in coming days and into month end on Friday. We lack any substantial confidence in a sustained rally amid favourable Midwest weather conditions with rain falling across the drier areas of IA/MN. This rain will help to ensure higher soybean and corn yields in the W Midwest and the market is becoming more accommodating of a 164-167 bushels/acre corn yield.
  • Russian wheat yields are surprising to the upside with some analysts placing the crop at 58-59 million mt. There appears to be a similarity to last year when yield/production also came in above expectation, and if the trend remains we could well see Russia as an active exporter particularly as the Rouble continues to remain weak. To that end it should not be forgotten that the Rouble/Hryvnia are at 4 and 3 month (respectively) lows in the run up to winter planting decisions, which does not suggest that we will see acreage declines.
  • In Europe we saw both London and Paris wheat futures markets pause for breath, particularly Paris as the €uro was slightly weaker. Perhaps of interest is the growing estimate of feed grade wheat in the Balkans and the EU 2015/16 feed S&D is starting to look somewhat complex in the context of a substantial drop in the corn crop as well as some restriction in grazing/pasture land across much of Europe. This is an area that will be worth watching in coming months.

28 July 2015

  • First things first, early trade in Chicago IS, as we suggested last night, showing some attempts at turning around some of yesterday’s losses. Whether or not this continues throughout the day remains to be seen and we will update tonight.
  • The surprise for Chinese soybean crush margins is that their domestic soybean oil values have failed to ignite any sort of rally with cash values perched at 8 year lows. The chart below reflects that China’s soybean crush margin contraction is not only a function of meal, but also oil. China is reported to hold 5 million mt of rape/canola oil in reserve. At some point, look for the Chinese Government to sell those ageing stocks – and replace them with fresh supplies. New 8-year lows in Chinese cash soybean oil prices would not bode favourably for late year 2015 soybean imports from the US.

  • NASS reported a modest increase in US soybean condition ratings with 13% of the US soybean crop rated as excellent, with good ratings falling 1% to 49%. The combined good/excellent rating held steady at 62% – steady with last week. The condition index, however, is up 1 point amid the boost excellent ratings. 72% of the US soybean crop is blooming and 34% of the crop is setting pods. The next 3-4 weeks of weather will be very important to US 2015 soybean yields. The next level of support rests at $9.00-9.20 basis November futures. China’s purchase of US soybeans for the new crop year through mid-July is at a 9 year low. It’s US export demand that bodes poorly for a sustained rally.

  • US corn conditions rallied 1%, with 70% of the crop rated good/excellent. Improvement is noted across; IL, MI, KY, MO, MN and NE, while modest 1-2% declines are noted in NC, PA, SD and WI. MN ratings at 87% good/excellent are the 3rd highest on record. Yield models points toward an August estimate of 165-167 bushels/acre, and conditions have increased counter-seasonally since early July. World fob spreads are little changed, and US corn for October delivery is prohibitively expensive. The market is ripe for a Turnaround Tuesday, but rallies in the coming weeks will be fleeting amid improving yield potential and a lack of export demand. We maintain that a test of $3.70 basis December, lies in the offing with harvest lows depending very much upon US corn export demand.

  • US spring wheat crop conditions improved 1%. The crop is rated as 71% good/excellent, vs. 70% a year ago. PNW crops continue to deteriorate, but this has been more than offset by improvement in ND. Note also that spring wheat harvesting is 5% complete, vs. 1% a year ago, and looks to accelerate into early August. Progress has begun in all states but Montana. A rather heavy bout of rain is projected across the whole of Western Australia’s wheat belt in the next 72 hours, with totals of .50-1.00” to be widespread – the GFS weather model indicates localised totals upwards of 2”. Should the forecast verify, July precipitation across Australia’s wheat belt will exist at 70-150% of normal. Top and subsoil moisture levels are above last year. Russian prices remain the world’s benchmark, and this benchmark is unchanged at $4.70-4.80/bu, basis spot Chicago. Additional fund liquidation is expected in the days ahead, but the decline will slow dramatically. Our initial downside target has been met and a more neutral outlook is advised below $5.00. However, we maintain that 20-30 cent rallies should be sold amid record global stocks and lack of threatening Aussie weather.

27 July 2015

  • The days corn, wheat and soybean markets started out under pressure with fresh long liquidation from the specs, many of whom have been on the wrong side of the market since the recent rally began. Additionally, improved Central US weather and ongoing lacklustre export demand has seen the “wet weather bulls” pushed to the sidelines. The speed of the decline has surprised many, and has potentially left some of the reluctant bulls holding onto losing positions, which if unwound in coming days may well see the decline continue – possibly even increasing the pace of decline. As ever, the spectre of a “Turnaround Tuesday” will hover over tomorrow’s markets.
  • We have also keep in mind that we are approaching yet another month end, which is always renowned for a degree of position squaring and cash withdrawals and this could well impact the markets as the week progresses.
  • In China the Dalian grain futures markets closed sharply lower to start the week with corn futures posting the biggest losses with nearby futures shedding $0.17/bu and back months losing as much as $0.32/bu as rumours continue to circulate that China may well alter the minimum price farm programme  and permit domestic corn prices to fluctuate in line with world levels. Soybean meal futures also posted sharp losses on slowing demand and oversupply of soybeans at ports. To make matters worse, if that was possible, the Shanghai stock exchange took an 8.5% dive to start the week on the back of economic worries and renewed investor selling. Crude oil prices continued to decline lending an additional negative tone.
  • As the day progressed one commentator described Chicago markets as having received a “bloody nose” as the losses continued. Biggest losses have been seen in summer corn and soybeans where the funds held their longest positions and the rush for the exit door was greatest. Looking back, investors have seen a whipsaw action having  been run out of their previous shorts into longs (wet weather June rally) only to be whipped the other way on the current decline. A summer break cannot come too soon for many participants.
  • The Brazilian real fell to fresh lows against the US$ early today but stabilised as the day progressed but there is a belief that 3.5 is the ultimate target in coming weeks. Bear in mind that the Real has fallen around 25% since the start of the year whilst soybeans have only declined around 6%!
  • We await crop ratings later tonight, after the close, and there is a wide expectation for stabilisation or even and improvement as the weather has been more kind than in recent weeks. If we see a 2-3% improvement in corn and soybean ratings, as some are suggesting, it is possible that the price decline could well see follow through selling again tomorrow. As previously mentioned out inclination is for something of a “Turnaround Tuesday” as some profit taking emerges after today’s sharp losses.
  • In summary, the bulls have taken something of a beating today as it feels very likely that the season highs were made in late June and early July, and follow through to the upside has eluded them. Unless we see a dramatic weather shift in the US it feels very much as if any further rally should be viewed as a selling opportunity. Continued US$ strength and poor export demand appear the probable course in coming weeks, and maybe months, which will not pressure our views on suggested price direction.
  • In Europe the weaker CBOT markets and a stronger €uro took Matif wheat to a five week low, which has also had the added benefit of reducing the uber-competitive Russian prices as Black Sea levels remained pretty much unchanged. For a comparison, since last week’s GASC tender, Chicago wheat has shed $0.30, Matif €8 and Black Sea is all but unchanged! The European crop unit, MARS reduced EU soft wheat yield estimates to 5.8 mt/ha from 5.85 and compared to last year’s 6.14 whilst corn was lowered to 6.71 mt/ha from 7.22  month on month and 8.07 last year.