21 January 2016

  • Egypt’s GASC has once again tendered for wheat, on this occasion for 20 Feb-Mar 1 shipment, and has secured a total of 235,000 mt with Romania and France each picking up 60,000 mt and Russia the balance of 115,000 mt. Volume of offers appear to be down somewhat on uncertainty of payment date and also the reduction in ergot content levels to 0.05%.
  • Markets today have received something of a boost from crude and equity markets bouncing somewhat from extreme oversold positions.
  • Ethanol stocks in the US have risen again to a four year high of 21.94 million gallons, which is seen as “disappointing” and perhaps reflects the reduced economic incentive for blenders to utilise ethanol. Ethanol is priced well above unleaded gasoline and consequently the ethanol producer will have to either find export markets or face even greater stock build into early spring time. Surely ethanol production profitability will be limited in coming weeks/months!
  • EU wheat exports for the week were some 511,000 mt, which is below the pace required to hit the latest USDA forecast of 32.5 million mt. Current export pace suggests a more modest 28-28.5 million mt total, which would see further stock building. Russian fob offers continue to soften  and it feels as if we are on the brink of a fight to secure the few remaining spring and early summer demand requirements. The EU, Russia, Canada and US have to become more competitive if they are to reach their ultimate export targets, and it feels as if this is a tall order for them all to succeed.

20 January 2016

  • Crude oil posting new lows, below $27, which is the lowest since 2003, and the DOW Jones index some 500 points lower (and other indices correspondingly lower) did not add much in the way of support today. Weakness in global economies with energy producing nations struggling to raise sufficient cash for their own domestic economies is an ongoing issue.
  • One issue previously ignored is that some $730 billion exited the worlds emerging economies inn the last year. This record exodus leaves countries like Brazil, Egypt, China, Turkey and Russia with reduced funding ability going forward. Those who borrowed cheap US$ during the US QE programme may now be struggling to repay as the US$ rallies. This is introducing some concerns into European Banks as far as their non-performing loan portfolios are concerned! Watch this space!!!

19 January 2016

  • Informa Economics have today released their latest estimate on 2016 US corn and soybean planting acreages which shows a month on month reduction in corn to 88.869 million acres (from 88.926 in December) and an month on month increase in soybean acres to 85.23 million (from 84.537 in December). For comparison purposes the January USDA figures were corn at 88 million and soybeans at 82.7 million. It should be noted that Informa’s figures are based upon survey data, which (for this latest update) was collected in early January, they will resurvey ahead of the USDA’ March report and update planting prospects at that time.
  • Chinese economic growth has been pegged at 6.9%, the slowest since 1990, but generally in line with government expectations. Equity markets in Asia appear to have responded positively adding to a support for commodities in general today.
  • It seems that the return to work in Chicago is seeing fund short covering which is triggering something of a rally in prices, much of the buying has been associated with the large fund net short position and some reduction in exposure.
  • Currencies remain an issue with US$ strength showing again, the Brazilian Real has traded at 4.05:1 and the Russian Ruble at 78.6:1 and weakness in the “emerging” market currencies continues to limit import demand.
  • Argentina is continuing to offer discounted prices for wheat to importers, which is in turn triggering cheaper Ukrainian and Argentine corn offers. Global grain markets are not, at this time, responding to higher Chicago prices, which continue to highlight the US’s lack of competitiveness.
  • Soybean crush margins are barely profitable in China – and mostly negative across the remainder of the world. The world appears to be saturated in protein meals with cold weather not causing much of a bounce in the Midwest. The poor soy crush margins will likely cause further slowing of world soybean trade.
  • The latest long range forecasts has El Niño holding through the N Hemisphere summer as a warm phase of the Pacific Decadal Oscillation sits in a warm phase. This would reduce the chance of summer drought in the Central US  and we see no reason to bet against trendline US corn and soybean yields in 2016.
  • World feed wheat prices are struggling looking for demand and Egypt’s GASC is slow to book early February wheat milling needs as traders talk about a dollar shortage in Egypt. Our current view is that the current Chicago rally will end in the next few days with a new bearish trend to unfold heading into late March or April. We would place price objectives for spot Chicago corn to fall to $3.20, spot Chicago soybeans to $8.20 and spot Chicago wheat to $4.40 by spring.

14 January 2016

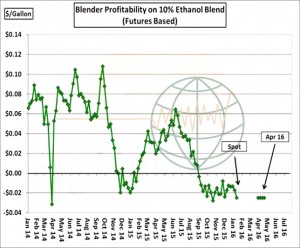
  • The graphic below charts futures-based ethanol blending margins, which are deeply negative into spring. Despite ongoing near record ethanol production, domestic blend demand has been a bit weak, and ethanol stocks continue to build. Eventually (when?), production margins will reduce to slow the US ethanol grind and, overall, ongoing weakness in energy markets will continue to weigh on major commodity indexes. For now the US corn balance sheet cannot afford to lose domestic use.
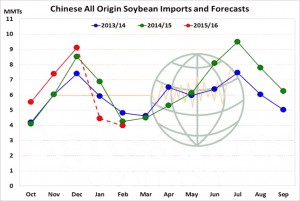
  • As of yesterday, Chinese Customs data showed December soybean imports of 9.1 million mt, a five month high and record large for December. Based on US/S American shipments, we estimate Jan imports of 4.4 million mt and Feb imports at 4 million. Despite slower imports in Jan-Feb, the pace of imports is still on track to hit the USDA annual forecast of 80.5 million mt.
  • The USDA reports this week were not bullish, but also did not offer any bearish surprises. Last week’s CFTC report showed funds with the largest net short position since June, and short covering appears to be the only supportive feature in the market. We continue to view price rallies as short lived and selling opportunities at this time, until such time as there is some fresh news with a bullish tone.
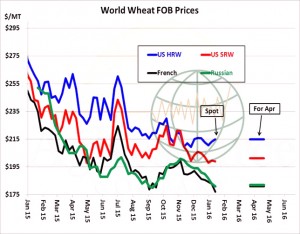
  • As mentioned previously, world wheat cash markets were unmoved by the USDA’s US winter wheat seedings number, and Russian offers actually ended weaker despite the report. The graphic below illustrates the recent widening of US premium to other origins, and US exports will be the market’s central focus in the near term. French fob offers have reached a season cash low, perhaps illustrating the stagnant export demand and trade. Snow cover has expanded as projected across C and E Europe and the Black Sea, which should add some insulating protection in advance of the forecast lower temperatures.
  • The USDA has today released its weekly export figures as detailed below:

Wheat: 290,600 mt, which is within estimates of 150,000-350,000 mt.
Corn: 669,300 mt, which is above estimates of 400,000-650,000 mt.
Soybeans: 1,127,400 mt, which is within estimates of 900,000-1,300,000 mt.
Soybean Meal: 64,700 mt, which is within estimates of 50,000-180,000 mt.
Soybean Oil: 41,200 mt, which is above estimates of 5,000-20,000 mt.

  • Our comment on this week’s US exports is that whilst corn and soybean volumes were at the higher end of trade expectation they are not market moving, and the trade now seems to appreciate that despite a cut in the US winter wheat seeding area world cash prices have continued to drift lower and US Gulf premiums to both Russian and EU origins are unsustainable. Consequently we are seeing US futures levels easing back following Russian and French cash levels.
  • Brussels has issued weekly wheat export certificates totalling 783,342 mt, which brings the season total to 14,762,856 mt. This is 900,626 mt (5.75%) behind last year.
  • There has been a suggestion that Chinese grain stocks (wheat, rice and corn) are now upwards of 500 million mt compared with the USDA’s figure of 250 million. Consequently the prospect of a curtailment in shipments, potentially to a substantial level and in the very near future, looks to be very real.
  • In conclusion, we remain of the view that ag markets require adverse weather, a significant boost in Chinese demand (preceded by economic stability – of course) and/or increased biofuel consumption in order to sustain any lasting rallies. At this time none of these are available and whilst we may see price hiccups or bounces along the way (as has been the case post USDA this week) it feels very much as if US export demand and overall global trade will remain the key price drivers for the time being.

12 January 2016

  • US soybean crush margins have steadily declined since August, and when one considers that cash soybean meal is being traded at values well below Chicago, the margins for US soybean processors is dismal, and unlikely to improve anytime soon. We would expect that an oversupply of cash soybean meal will ultimately weight on Chicago soybean meal futures and produce lower lows in futures in coming months. This year’s crush margins are very different from last year – limiting demand for beans.

  • Brazil’s CONAB updated their 2015/16 crop estimates with corn 300,000 mt higher at 82.3 million mt (split 27.76 million mt for the first crop and 54.56 million mt for the safrinha crop). Soybeans were estimated 102.1 million mt, down 400,000 million mt month on month and wheat was 100,000 mt lower at 5.5 million mt.
  • Today’s January USDA WASDE report offered something of a reprieve for the bulls and the big question now is, “Will it last?”. Both 2015 US corn and soybean yields were reduced and soybean harvested acres were trimmed back too. Winter wheat seeding fell below the average of trade expectations at 36.6 million acres, down some 2.72 million acres from last year. We would expect to see midwest farmers plant more soybeans, sorghum and corn in place of winter wheat, which may come through in future reports.
  • In the face of favourable S American weather if still feels as if the report is unlikely to change the longer term market direction, but a fund short covering bounce looks likely. The approach of the S American harvest and lacklustre global demand continues to look a formidable longer term obstacle to significant and lasting price increases.
  • It remains true that the funds are big shorts and the January report was supportive. However, cuts of 53 million bu of 2015 US corn production, 51 million bu of 2015 US soybean production and a lower US winter wheat seeding total does not alter prevailing bearish price trends. Once the fund short covering runs its course, the market will understand that Argentina and Brazil are aggressive in offering corn, wheat and soybeans for export, and that WASDE has yet to fully reduce US corn, soybean and wheat export estimates enough. Moreover, we believe that the USDA is still way too high with its 2015/16 US soybean crush estimate. Unfortunately, the January report does not build demand in a more worrisome macroeconomic world. Allow the rally to run its course would be our view at this time.

To download our USDA Report recap as a pdf file please click on the link below:

USDA-Recap-12 Jan 16

11 January 2016

  • Crude oil markets have fallen to a new 14 year low of $32.73/barrel earlier today and appear intent on targeting the $30 level (or lower). Technical chart support rests at the 2002 lows of around $20/barrel and abundant supplies together with slowing global growth do not bode well for an immediate recovery. Whilst it would normally be expected that Chicago agri markets would follow lower in sympathy (which they are to an extent) tomorrows USDA reports are providing some support today. Clearly the outside economic world leans bearish for now.
  • We have an interesting premium in January soybean futures over the March contract (some 19 cents) leaving many pondering why! Fundamentally there looks as if the US will hold as much as 500 million bu carryout for the 2015/16 crop and this would point to the spread being “wrong”. It is possible that damage to the load facilities in the Illinois/Mississippi rivers is greater than currently admitted, which could account for the nearby premium, but this needs to be watched.
  • In the US gasoline prices are falling faster than ethanol and blending margins are falling into deep red territory, leaving the potential for further US stock build this week. The speed of decline in US energies is making it difficult for ethanol to keep pace, and falling corn values reflects, at least in part, fears for a bearish feeding demand picture amid negative margins.
  • Fob wheat values in the Black Sea continue to decline as volume offers increase and the value of the Russian Ruble and the Kazakhstan Tenge hit all time lows again. Such currency positions do nothing to discourage both production and exports from the respective nations.
  • The interesting point in today’s price action was the failure to sustain the early rally and the funds lack of desire to exit their (huge) net short positions ahead of tomorrow’s report. The macro winds are blowing in a deflationary direction and the concern has to be that Central Banks will be unable (or unwilling) to gather sufficient QE support to change the trend. One source described crude oil as the “canary in the coal mine” of what may occur in the Chicago grain markets this summer in the absence of adverse weather in any or all of the US, Russia, Europe or China. The potential for prices cheaper than any had previously thought possible really does exist. Our view is that if the market rallies after tomorrow’s report it will be an excellent short trade opportunity.