To download our contemplation on yesterday’s WASDE report please click on the link below:
Author Archives: simon
10 November 2015
- Today’s WASDE report was viewed as slightly bearish, and the market has agreed, with US corn, wheat and soybean end stocks all raised by more than was anticipated. In addition, Chinese corn stocks were raided, substantially, and it now leaves the weather to turn adverse for any meaningful rally to develop.
- US corn yield was increased by 1.3 bushels/acre to 169.2 with production up 99 million bu from last month. Yield improvements of 3 bushels/acre plus were seen in IA, MN, NE and ND, which more than offset declines of 1-2 bushels/acre in IL, OH and TN. US corn exports were reduced 50 million bu (as we have been suggesting) whilst ethanol usage was also reduced. The combined impact is an increase in end stocks of 200 million bu month on month. From a feed grain perspective it should also be noted that sorghum stocks were raised 16 million bu and barley stocks were up by 1 million bu.
- Soybean yield was also raised 1.1 bushels/acre, to 48.3 (a new record) with significant month on month increases noted in IL, IA, KY, MI, MN, TN and WI. Soybean consumption was increased in the face of growing supply and also the recent pace of shipments. Crush grew 10 million and exports 40 million, yet supply has grown more than can be consumed and US end stocks are up 40 million bu from October at 465 million bu.
- That really accounts for the report highlights, despite less than ideal summer weather we have corn and soybean yields near or above record levels, presumably due to a combination of improved varieties, technology and crop management.
- US wheat exports were (at last) reduced by 50 million bu to reflect current export pace as well as slower global trade trends and US domestic consumption was left unchanged leaving end stocks up by 50 million at 911 million bu.
- From a global perspective, Chinese 2014/15 corn stocks were revised higher by 19 million mt whilst new crop feed was reduced leaving Chinese end stocks a massive 24 million mt higher than October’s figure.
- World wheat stocks were lowered 1 million mt to 227.3 (still a record) with global production unchanged and domestic use up a million. Major exporters balance sheets were largely unchanged although the EU’s exports were boosted slightly (33.5 million from October’s 33 million) despite current export pace lagging somewhat, whilst EU end stocks were pegged at 16 million mt (up a million), the largest since 2009. It feels as if the USDA still has work to do in fine tuning and adjusting some of its global wheat trade figures and appears to be overstating global consumption somewhat.
- Chinese soybean imports were increased to 80.5 million mt from 79 million, which is in line with Oct/Nov import pace, and this higher use has triggered a decline in global end stocks of some 2.3 million mt to 82.9 vs. 77.6 in 2014/15.
- Doubtless the report is short-term bearish and markets are moving closer to season lows, will they test and break out to the downside? Whilst we would be pleased to see this happen (and justify our long-held bearish outlook) it feels as if this is a tall order despite the fundamental picture supporting this scenario. We advise caution and do not encourage an overly bearish stance.
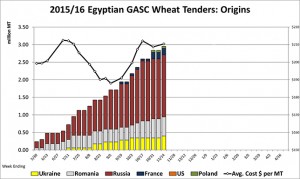
- In other news Egypt’s GASC has secured a further 115,000 mt of wheat in its latest tender, which was for 11-20 Dec shipment. Russia secured 60,000 mt with Ukraine picking up the balance at an average price of $210.41 basis C&F, which is about $2.00/mt above the last tender ten days ago. There were plentiful offers of French wheat but, once again, they were more expensive when freight costs were included and France received the cold shoulder from Egypt – again.
- Our USDA recap can be downloaded by clicking on the link below:
9 November 2015
- Chicago markets are generally lower to start the week, wheat specifically so with the front three month contracts all around 3.5% lower with less than an hour of trading to go. Rainfall in Brazil’s Mato Grosso and Goias over the weekend was a bit better than expected. A weaker US$ and spot crude oil down $0.50/barrel has not added any support.
- Chicago wheat has pulled back from its secondary “top”; 7 October and 4 November both marked the recent highs in the December ’15 contract. Ukraine is showing no sign of slowing exports and their weather forecast continues to contain rain that will doubtless be welcomed when it actually falls. The net fund position, which is short, shows no immediate requirement to be covered as N Hemisphere weather conditions remain non-threatening, for now.
- Tomorrow’s USDA WASDE report is expected to show a moderate boost in US end stocks but the real key will be how the global corn trade matrix is adjusted, if at all. Brazilian export commitments continue at record pace and US exports continue to languish, particularly when compared with last year. Unless we see US corn and soybean yields increased by more than 0.5-1.0 bushels/acre it could well be the case that we have already seen season lows.
- Finally, Brazilian independent truckers have started what is reported to be an indefinite strike blocking traffic in some states.
7 November 2015
To download our weekly update as a PDF file please click on the link below:
Our weekly fund position charts can be downloaded by clicking on the link below:
5 November 2015
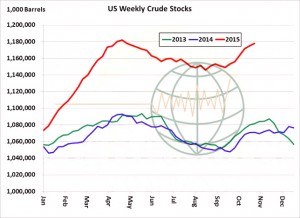
- US crude oil stocks continue at burdensomely high levels, and this is serving to cap and limit rallies. Until this oversupply is worked through via better consumption, we doubt that ethanol production and blending margins will improve much. The EIA today pegged crude stocks as of last Friday at 1,178 million barrels, up 10% from last year. Unleaded gasoline stocks are up 7% from a year ago and ethanol stocks are up 9%. Lasting rallies in energy prices are not expected into early 2016.
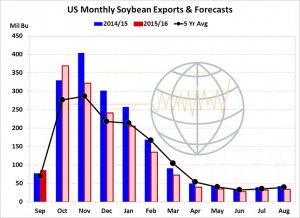
- Official US soybean exports for the month of September were reported this morning at 86.4 million bu, similar to what had been indicated by the FAS monthly inspections report that was released in early October. The September total was at a three year high and the second best monthly total on record due to adequate stocks and building Asian demand. A strong shipment pace has continued through October a record or near record export total is expected for the month. A peak in weekly shipments has been reached/nearly reached, and we expect weekly monthly totals to now decline. Initial Brazilian exports will be available in February, which will bring US exports to a crawl in the remainder of the year. We see the USDA forecast at 1,675 million bu as too high by at least 75 million.
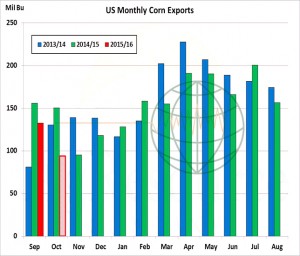
- Official US corn exports in September totalled 132.6 million bu, down 24 million from a year ago and down 23 million from September of 2014. Using weekly FGIS shipment data, we peg corn exports in October at a meagre 94 million bu, down 56 million from last year. Total Sep-Oct shipments of 227 million are down 80 million (20%) from a year ago, and recall the USDA’s 2015/16 export projection is unchanged from the previous year. Notice in the graphic that there’s strong seasonal tendency for shipments to rise beyond February – as soybean exports more or less come to a halt – but this is accounted for in year on year analysis. The US must average exports of 162 million bu in each month moving forward, and assuming shipments are not boosted until beyond February, exports must average close to 190 million in the second half of the crop year. This is not expected, as outstanding sales are down 35% from last year. The USDA’s forecast is too high.
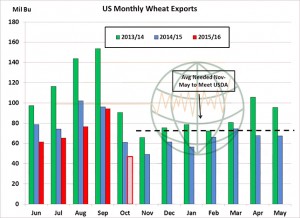
- US wheat exports in September totaled 94 million bu, up 18 million from August but down 2 million from September of 2014. A sharp decline in official shipments is expected in October, as FGIS data indicates exports of just 47 million bu, down 14 million from the year. Jun-Oct US wheat exports are tallied at 345 million bu, down 67 million (16%) from last year, and we struggle to see a boost in exports in the foreseeable future. Jun-Oct shipments account for just 41% of the USDA’s, which is an historically low number, and in recent years improvement beyond Oct has hinged upon export controls or adverse weather in the Black Sea. Without adverse weather, we expect the USDA to eventually lower its forecast 10-25 million bu to a new multi-year low. US origin wheat is the world’s most expensive for delivery into February.
- Today saw the Bank of England leave interest rates unchanged at 0.5% once again as weak inflation data leaves the timing of a rate increase ever more uncertain.
- The USDA has today released its weekly export figures as detailed below:
Wheat: 105.600 mt, which is below estimates of 300,000-500,000 mt.
Corn: 574,900 mt, which is within estimates of 450,000-650,000 mt.
Soybeans: 656,500 mt, which is below estimates of 1,400,000-1,800,000 mt.
Soybean Meal: 256,300 mt, which is within estimates of 150,000-350,000 mt.
Soybean Oil: 36,200 mt, which is within estimates of 10,000-80,000 mt.
- As a consequence of what can only be described as weak US export data markets moved lower today. Both wheat and soybean figures were well below trade expectations and some are now questioning whether we have seen peak Chinese purchasing of soybeans following an extraordinary first half October volume. For their respective crop years to date, the US has sold 1,026 million bu of soybeans, down 22% from a year ago, 518 million bu of corn, down 32% from last year, and 472 million bu of wheat, down 17%. The market has lost interest in the pace of shipments, and has turned to its focus to the pace of new demand.
- It’s becoming more evident with each weekly sales report that the USDA is overstating corn export demand by some 100 million bu. Wheat exports are viewed as slightly too high assuming normal N Hemisphere weather, and following this morning’s report, the trade is questioning soybean exports. Recall the USDA projects US soybean exports to fall just 10% in 2015/16. January soybean prices are closing in on September’s lows.
- Brussels has issued yet another relatively low week of wheat export certificates of 386,976 mt. This brings the season total to 7,959,806 mt, which is 2,439.600 mt (24.46%) behind last year.
4 November 2015
- The graphic below displays rallies in US corn price from the September low to the Sep-Nov high. Our work suggests it would be perfectly reasonable to expect a rally but the extent will be a function of the stock/use ratio. The higher the ratio, the weaker the season’s rally. In the light of the October USDA figure we would expect a recovery in front month corn of some 8-10% from the September price low ($3.61), which points to a test of $3.95-4.00 basis December or March Chicago futures. Any lasting rally will require lasting and widespread damaging weather.
- Brazilian trade data for the month of October was reported on Monday, showing soybean exports at a 12 year high for the month, at 2.1 million mt. The official government data was just short of the 2.5 million mt total that had been implied by private shipping data. In Feb-Jan marketing year that is used by the USDA, exports are record large at 51.6 million mt. The USDA increased their export estimate by 2.65 million mt to 52.9 million. To reach the USDA target, exports need only average 400,000 mt/month. However, vessels are surprisingly still being added to the Brazilian lineup, and total export commitments are now estimated at 54.6 million mt. Increasingly, it look as though both the USDA and CONAB have understated last year’s crop size and both are underestimating current year exports.
- Official Brazilian corn exports in October totaled a record 5.5 million mt, up 2.0 million from September and up 2.4 million from October of last year. After a slow start to the marketing year, exports have surged, and we expect this torrid pace of shipments to continue well into early 2016. Crop year to date corn exports from Brazil rest at 13.5 million mt, up 30% from last year, and this year on year difference will continue to widen in the months ahead. Brazilian fob offers are $7-9/mt ($.17-.23/bu) cheaper than US offers into January, and there’s been talk of new crop corn offered for delivery beyond next August. The Brazilian Real, which has strengthened in recent weeks, is still historically weak and this is helping exports. There’s been no sign that Brazilian corn sales are slowing.
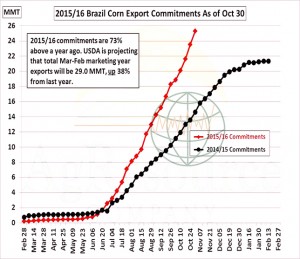
- However, the official shipment pace only begins to tell the story. It is possible to track total Brazilian export commitments through official exports as well as vessel lineup data, and total commitments are substantially above year ago levels and are well ahead of the pace needed to meet the USDA’s forecast. Brazilian corn export commitments as of October 30th totaled 25 million mt, up 73% from last year and already 87% of the USDA’s forecast, which we believe is too low. Record shipments are expected in Nov and Dec, and only the beginning of Brazil’s soybean loading program in February will slow corn shipments. Brazilian production, along with their willingness to sell into the world market cannot be understated. Upward revisions to Brazilian exports will be countered with a reduction in US exports. We estimate final Brazilian corn exports at 32-33 million mt, vs. the USDA’s 29, and still ending stocks will be historically large at 15-16 million mt.
- An interesting development in Egypt in the form of an international poultry tender has been announced today. The details are to be released tomorrow, but it is for whole poultry and poultry parts, doubtless more will be revealed in the full detail.
- Reuters have reported that spot trading on Argentina’s main grains and oilseed market has slowed sharply as farmers hold on to their crops in the expectation that this month’s presidential run-off vote will lead to a reduction in hefty export taxes. It is well known that Argentine farmers have long hoarded their crops as a hedge against the country’s high inflation rate. Argentina’s tax agency said this week farmers were holding back an estimated 19.7 million mt of soybeans – equivalent to one third of Argentina’s annual soybean crop – as well as 21.4 million mt of corn and 9.5 million mt of wheat.
- Today has seen “technical considerations” drive Chicago wheat to new weekly highs and this has spilled over into corn and soybean markets. December wheat in Chicago rallied through its 100 day moving average amid lacking fundamental news, in actual fact global cash markets have been displaying a weaker tone.
- Weather models are offering helpful and widespread rainfall acrossRussia’s winter wheat belt next week. Some 0.5-0.75” is forecast, and this represents 70-100% of normal for early November. So far C and E Europe have seen normal to above normal rain since the beginning of October. Australia’s forecast is drier in Victoria and New South Wales in the coming ten days easing fears of losses. The point being made here is that with unchanged global cash prices, wheat fundamentals have not changed and huge surpluses remain.
3 November 2015
- Turnaround Tuesday has struck again! Chicago markets are higher at tonight’s close as US interior basis levels (corn in particular) rises. According to ADM’s CEO, Juan Luciano, farmers (he suspects) have sold some 30% of new crop corn as opposed 45% on average and soybeans 35% vs. 60% on average. Lack of farmer selling is supporting prices.
- Informa Economics, in advance of next week’s UASDA figures, raised US 2015 corn yield to 170.1 bushels/acre (previously 168.4) and output to 13.718 billion bu (previous 13.561). Soybean yield was also estimated higher at 47.9 bushels/acre (previous 47.2) with output at 3.952 billion bu (previous 3.878). The trade has likely priced in a boost in soybean yield, so Informa’s estimate should be viewed as neutral today, whilst their corn figures, if correct, are modestly bearish – adding 100-150 million bu to stocks aside from any export lags that might take place.
- Brazil saw record corn exports in October, 5.3 million mt vs. 3.5 in September and 2.6 million mt of soybeans vs. 3.7 in September. Whilst the corn shipment pace is not a surprise it is the suggestion that this sort of pace could continue into Dec/Jan that really is of significance, keep in mind commitments (sales made but not yet shipped) are up 70% year on year. The USDA’s projection is a mere 40% increase in annual Brazilian corn exports.
- NASS last night reported soybean harvest progress through Sunday at 92% complete vs. the five year average of 88%. Harvest was complete in MN and ND, with eight other states reported at 95% complete or above. After the close, FC Stone estimate a US soybean yield of 47.5 bushels/acre with a crop size of 3.919 billion bu, we hold to a longer term fundamental bearish outlook, with any post harvest rally to offer selling opportunities.
- US corn harvest as of Sunday reached 85% complete, on par with trade estimates and up six points from the five year average. Farmers will remain tightfisted into early 2016, which will support domestic basis but also maintain sizeable premiums in Gulf basis levels. The lack of competitive US offers will weigh on rallies to $3.90/bu plus basis December. FC Stone raised their corn production forecast 2 million bu to 13,543 million, with yield pegged at 168 bushels/acre.
- US winter wheat good/excellent ratings were put at 49%, vs. 47% a week ago and 59% last year. Substantial improvement (5-14%) are noted in AR, ID, KS and OK; declines are noted in TX and WA. National ratings should improve further next week amid mild temperatures and additional rainfall in E OK, E KS and the S Midwest. Recent weeks have proven that wheat is overvalued above $5.20, and better competes with other origins below $4.80.
2 November 2015
- Chicago has started the week lower on all fronts, corn, wheat and soybeans with wheat leading the way after fund short covering last week. Rain, which is forecast in E Europe and Black Sea regions in the 8-14 day outlook, will be much welcomed and has added to weaker tone (for now).
- Weekly US export inspections were “robust” in soybeans but elsewhere less than inspiring. The last week, ending Thursday, saw US exporters ship 18.8 million bu of corn (last week 16.3 million bu), 6.3 million bu of wheat (11.7 million bu last week) 94.1 million bu of soybeans (98 million bu last week). Soybean inspections were at the higher end of trader expectations whilst the grains were in line. The respective marketing year data shows 206 million bu of corn (down 24% year on year), 333 million bu of wheat (down 18% year on year) and 441 million bu of soybeans (up 9% year on year). Recent rainfall in the US Gulf is expected to slow exports, which will reflect in next week’s figures.
- Other news is thin on the ground and the trade awaits the 10 November USDA crop report, which is not expected (based upon history) to provide any significant or unexpected news.
30 October 2015
To download our weekly update as a PDF file please click on the link below:
Our weekly fund position charts can be downloaded by clicking on the link below:
29 October 2015
- The USDA has today released its weekly export figures as detailed below:
Wheat: 550,500 mt, which is above estimates of 350,000-550,000 mt.
Corn: 708,800 mt, which is above estimates of 300,000-500,000 mt.
Soybeans: 2,156,000 mt, which is above estimates of 1,600,000-2,000,000 mt.
Soybean Meal: 218,700 mt, which is within estimates of 150,000-350,000 mt.
Soybean Oil: 82,100 mt, which is above estimates of 30,000-60,000 mt.
- Brussels has issued another relatively low week of wheat export certificates of 399,095 376,969 mt. This brings the season total to 7,572,830 mt, which is 2,028,631 mt (21.13%) behind last year.
- Chicago markets have today seen the grains gain and soybeans ease a touch in a continuation of what feels like confused price action.
- The International Grains Council (IGC) has again raised its forecast for global coarse grain harvests (fourth consecutive month) to 1.999 billion mt, a 3 million mt increase, but 27 million mt lower than the previous year. Global demand was raised a touch, by 5 million mt, to 1.991 billion mt.
- Egypt’s GASC has once again purchased wheat in their latest tender, this time for 1-10 December shipment. They secured 240,000 mt with 120,000 mt for France, and 60,000 mt each from Romania and Poland (a first this season) at an average price of $208.78/mt basis C&F, close to $3.50/mt below 15 October’s purchase.

