30 September 2015

  • Looking at global wheat trade, US export sales have failed to improve in recent weeks, and total commitments as of mid-Sep stand at 405 million bu – a six year low and 15% below a year ago. Recall the USDA project final annual wheat shipments to rise 5% on the year, and to meet the USDA’s forecast an average weekly sales pace of 15 million bu is needed from now till May (vs. sales of 10-14 million in recent weeks). Poor US wheat export demand has been well documented, but looking at global data, the whole world seems to lack a wheat demand driver. Amid already lagging interest in forward coverage, it will be difficult for the US to boost its share of world trade amid completely uncompetitive Gulf offers. This is not news, but just how long this uncompetitive position lasts is uncertain – possibly into 2016 without adverse N Hemisphere weather.

  • 2015/16 EU wheat export licenses, which correlate well with actual exports, are down 23% from a year ago. Like in the US, this does not at all align with the USDA’s forecast, which calls for an annual decline in shipments of just 8%. We also calculate Jul-Sep Black Sea (Ukraine, Russia and Kazakhstan) shipments at 13 million mt, down 11% from a year ago. The  graphic below summarises world trade from major exporting countries through the first quarter of the international trade year. Total trade is down 4.1 million mt from the previous year, which matches the USDA’s forecast but also illustrates that lack of a global demand driver following better than expected harvests in North Africa and the Middle East.

  • Benchmark prices in Russia and Europe have rallied noticeably in the last week, but still exist well below recent years. Russian wheat is offered at $187-193/mt for delivery into December, vs. $230/mt in late September last year. EU origin is buyable at similar levels for Oct-Dec arrival, vs. EU offers a year ago of $225. Also, Gulf wheat premiums to other origins have not changed, and despite the advance in Black Sea prices, US wheat remains some $25-27/mt above all other origins. A seasonal bottom has likely been scored in world wheat cash prices, but we fully expect exporters to jump at the chance to fill Egypt’s or any other major importer’s needs. Grain markets remain oversupplied, and we should be cautious on short term rallies.

  • Today the EU commission has estimated 2015EU soft wheat output at 144.6 million mt, up from 140.7 million mt a month ago whilst corn is forecast at 58.4 million mt, a reduction from 58.7 million mt last month. Rapeseed output is seen at 21.1 million mt and increase from last month’s estimate of 20.8 million mt.
  • The Russian government has agreed to the change in wheat export tariff as we outlined a few days ago and the effective date is 1st October.
  • NASS’s stocks and small grains report is viewed as mixed when viewed alongside trade estimates:

  • There is little to change the longer term picture and market reaction saw soybeans push to month highs testing $9 resistance pre report but have eased back subsequently. Corn turned negative although wheat was buoyed by the decline in crop size.
  • In summary, the report did not offer any major surprises for corn and soybeans, and did confirm another year of building corn, soybean, and wheat stocks. To date yield results from the field are confirming the USDA’s September estimates and our view is that harvest lows have not been reached.

29 September 2015

  • The correlation between soybean exports sales in early autumn and final shipments has been well documented. And though a similarly strong correlation is not available between corn sales and final exports, we are becoming increasingly concerned with the pace of exports – especially in the face of hefty discounts noted in S America and the Black Sea into December. It is possible to track S American export commitments weekly, and importantly, there has been no indication that sales from S America are slowing. The pace of Argentine corn purchases for exports has already met the USDA’s 2014/15 forecast. These purchases and final exports do not always match, but we expect Argentine exports to be revised 1 million mt higher by the final count. As of Monday evening, Argentine origin corn is the world’s cheapest.

  • Brazilian corn export commitments are similarly outpacing the USDA’s forecast, which is very likely a function of the safrinha crop still being understated. Corn export commitments to date stand at 16.7 million mt, up an incredible 75% from a year ago – and notice the shape of the line in the attached graphic. Logistical capacity in Brazil has been expanded, and there’s no reason Brazil won’t continue to sell and ship corn into late winter, at which point the soybean loading program begins. Brazilian corn exports, too, are likely understated by at least 1 million mt, if not more. Recall the USDA projects final Brazilian corn exports will be up only 35% from the prior year. Brazilian corn is offered at $.38- .42 over December futures, a $.20-.30/bu discount to US Gulf corn.

  • Our belief is that without a substantial hike in total world corn trade, the US must give S America more market share and take away market share from the US. We project total S American corn exports to reach a record 47 million mt in 2014/15, while US corn exports are likely 2-3 million mt too high. Again, US export sales of Sep/Oct correlate poorly with final exports, but price relationships do have an effect on monthly demand and the US is simply not competitive in the near term – and Gulf basis shows no signs of eroding. We should keep the lofty pace of S American exports – and weak pace of US exports – in mind amid upcoming changes to US production. A downward to revision in US export demand (which we believe is coming) will largely offset any 1-2 bushels/acre decline in yield.

  • NASS reported soybean crop conditions fractionally lower through the week, with harvest progress through Sunday advancing 14 points, to 21% complete. The main feature for the market this week will be Wednesday’s stocks report.

  • Corn crop conditions were unchanged at 68% good/excellent, and ratings should remain unchanged through the rest of the season. Harvest progress reached 18% complete, vs. 11% a year ago. The lack of a bigger advance is mostly a function of producers shifting to soybean harvesting, and we expect progress to meet the 10-year average (33%) by next weekend. It’s very possible that production is lowered modestly in October (yield results remain variable), but in the context of overstated export demand, a yield of 165 plus bushels/acre is more than adequate. We maintain that corn is fairly valued in a range of $3.40-4.00, basis spot, without dramatically adverse world weather.

  • US winter wheat planting progress has reached 31% complete, vs. 35% on average. 7% of the crop is emerged. Rain is needed in S Russia, but it’s tough to argue for prices above $5.20, basis spot Chicago, with French/Black Sea wheat trading at levels equivalent to $4.35-4.45.
  • Tuesday trade was mixed with positioning ahead of Wednesday’s report evident. Trade estimates are suggesting near to unchanged corn ending stocks and a modest drop in soybean end stock. Wheat remains stuck somewhere in the middle with any rally attempt stifled by a lack of US and global export demand, whilst Russia remains in a dry weather trend across the southern winter wheat belt in the coming ten days.
  • We would expect to see volatile initial reaction to Wednesday’s report but in the end it will be exports, yield data and global weather forecasts that will dictate price trend

28 September 2015

  • Early gains in Monday’s CBOT trade have given way to lower prices with under an hour of trade left. Soybeans have paved the way lower as trade disappointment emerged over daily sales announcements that failed to live up to China’s promised 13.2 million mt promised purchases from the US.
  • Outside markets have also eased with crude oil shedding $1.30/barrel and the US’s DOW 260 points lower at midday.
  • US cash soybean basis has eased as harvest pace picks up and yield estimates continue to exceed expectations. Corn cash basis has generally matched up to prior years and held up despite soybean’s decline.
  • Soybean sales out of Brazil are slowing rapidly and will now permit the US to take more of the centre stage in the coming months despite suggestions that S American offers will persist into early 2016. We start the week with US corn and wheat at the head of the “most expensive” list, however, after this week’s stocks report (Wednesday) markets will return their focus back to weekly export sales.
  • The latest weather updates have added some potentially heavy rainfall to Central and Volga regions of Russia whilst maintaining dryness across Ukraine and S Russia. S Russia is the key winter wheat region and weather premium will remain in place until we see higher precipitation in the forecasts.

26 September 2015

  • Yesterday saw Coceral update their quarterly EU crop forecasts, 2015 soft wheat was estimated at 148.2 million mt, which is an increase from 140.6 million mt whilst corn was reduced to 59.5 million mt from 67.5 million mt last quarter.
  • Friday saw Chicago grains and oilseeds sharply higher on fund short covering on the back of what was described as “technical considerations”. Chart resistance for both corn and soybeans is being tested, although not yet breached, and a break higher will likely see inevitable follow through buying and higher levels.
  • Aside from the technical picture, the only fundamental bullish input comes from dry conditions in parts of the Black Sea region and Australian wheat growing area. We saw wheat rally once the 50 day moving average was broken as funds followed and covered short positions. We struggle to believe, at this time, that any lasting rally can be realistically be sustained on the limited bullish input. The bulk of the US corn and soybean crops are yet to be harvested with yield trends improving and, as we have stated on many occasions in recent weeks, the world is awash with supplies. US export prospects remain limited and unless this situation changes, the pressure will remain in place.
  • On a practical note, we can find no correlation between Chinese signed letters of understanding for US soybean purchases and final Chinese demand. It appears that these promissory notes are just that…… promises between two commercial parties. In fact, there is no way to determine that China really follows through with its promises to secure US soybeans! Caveat Emptor!
  • Finally, Black Sea wheat prices closed the week at $190/mt for November which is up some $7.00 from the lows. The Black Sea is following the French wheat market upwards now that harvest is virtually completed.  Ukraine feed wheat is offered at $167/mt against US Gulf corn offers at $178/mt. There is no evidence of increased demand to validate the Black Sea rally!
  • Our latest Brazilian outlook is attached as a pdf file, please click on the link to download it:

Brazilan outlook Sep 15

24 September 2015

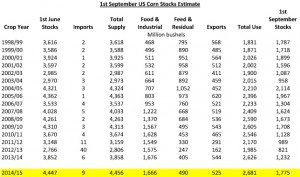
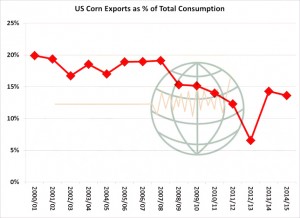
  • We peg final US 14/15 corn stocks at 1,775 million bu, 43 million higher than the USDA’s forecast in the Sept WASDE, 543 Mil above a year ago and the largest since 2005/06. The primary difference between the USDA’s and our 14/15 corn balance sheet lies in feed/residual use. We calculate fourth quarter domestic corn use at 2,156 million bu, up 75 million on last year amid higher projected feed use. Fourth quarter exports are counted at 525 million bu, down 19 million on the previous year. The attached graphic illustrates the fact that in the last decade, US corn exports have made up an eroding share of total US corn use, and it’s key that this changes to spur any lasting bullish trend. Somehow US corn must regain a competitive position in world feed grain trade.
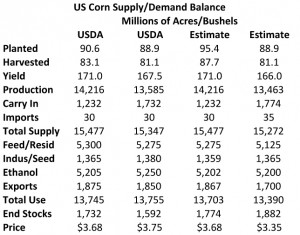
  • The 20-year yield projects a 1% boost in yield in each year into 2020. Assuming normal weather, national yields in a range of 165-175 bushels/acre will be much more common in the years ahead. Without improved export demand, ending stocks, will rise to 2-2.8 billion bu, barring adverse weather. Our updated old and new crop corn balance sheets are displayed below. Assuming unchanged crop conditions in recent weeks, we’ve left yield unchanged at 166 bushels/acre. New crop production is pegged at 13,463 million bu, which is slightly above total projected consumption, and so stocks will build in the marketing year ahead. Note that as the biofuel industry has matured, domestic usage categories will be little changed in coming WASDE reports. It’s now exports that will trigger meaningful changes in ending stocks through the coming crop years. US domestic demand is expected to stagnate.
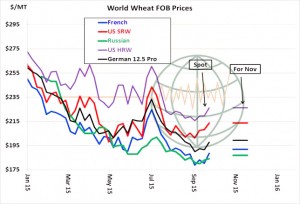
  • Yesterday we saw wheat rally another 10-13 cents on continued fund short covering amid dryness in W Australia and Russia. Technical considerations also lent support as December Chicago traded through its 50-day moving average. The market has rallied 45 cents since early September. World cash markets are also just a bit firmer, with Russian wheat offered at $184/mt for spot arrival and with French available at $188. Rallies in US futures, however, will likely prevent any improvement in US export demand and notice in the graphic below, US Gulf prices remain non-competitive, and Gulf wheat’s premium to the Black Sea has widened still further. US export sales through the week ending Sept 17 are estimated at 300-400,000 mt. An average of 400,000 mt is needed to hit the USDA’s annual US export target. Complete dryness is forecast across Southern and Central Russia through the next 10 days, with some hint of improvement thereafter. Confidence in this wetter outlook is low, but it will be watched closely. Any improvement in Black Sea rains will probably trigger a quick 20-30 cent break.
  • Russia’s deputy prime minister Dvorkovich has proposed a cut to its wheat export tariff to 50% of customs price minus 6,500 Roubles per tonne with effect from 1st October. This would cut the minimum tariff to 10 Roubles from 50, and it is also proposed that hard wheat is excluded from export tariffs.
  • The International Grains Council (IGC) has forecast global grain stocks to hit a 29 year peak by the end of the 2015/16 season, and this would include record volumes of wheat. Global stock levels were increased by 9 million mt to 456 million largely on the back of an optimistic outlook for wheat output, as well as higher barley, sorghum and oats volumes. 2015/16 global wheat output was forecast at a record 727 million mt, which is a 7 million mt increase on last year’s previous record. Improved EU prospects, where production of 155.5 million mt was forecast, were a significant factor and showed a 3.6 million mt uplift from the previous estimate although this remains behind last season’s 156.2 million. Increases in output estimates for both Russia and China also bolstered the IGC’s outlook.
  • Global corn prospects for 2015/16 were eased 1 million mt to 967 million mt, well below last year’s record 1,005 million mt. The likely switch from corn to wheat feeding left the IGC’s end stocks figures less dramatically changed.
  • The USDA has today released its weekly export figures as detailed below:

Wheat: 313,700 mt, which is within estimates of 250,000-400,000 mt.
            This year 282,800 mt; Next year 30,900 mt.
Corn: 426,300 mt, which is below estimates of 550,000-750,000 mt.
          This year 426,300 mt; Next year zero mt.
Soybeans: 1,316,000 mt, which is above estimates of 1,100,000-1,200,000 mt.
                 This year 1,316,000 mt; Next year zero mt.
Soybean Meal: 112,700 mt, which is below estimates of 120,000-275,000 mt.
                        This year 25,800 mt; Next year 86,900 mt.
Soybean Oil: 66,800 mt, which is above estimates of zero-40,000 mt.
                    This year 18,800 mt; Next year 48,000 mt.

  • The figures are less than exciting with year on year new crop sales all lower; wheat is 13% down, corn 30% down and soybeans 35% behind.

  • Brussels has issued weekly wheat export certificates amounting to  594,667 mt, which brings the season total to 5,196,935 mt, which is 911,621 mt (14.92%) behind last year.

  • Chicago markets have traded either side of unchanged with debate raging over the size and importance of China signing what are known as Mutual Letters of Understanding relating to soybean sales commitments. Suggestions that as much as 10 million mt is covered, although split over two crop years. Corn and wheat prices are again suffering with slow US exports as well as news of Russia’s proposed (modest) cut in export tariff that should allow consumers to buy with confidence in their likely fob price.
  • Outside markets are mixed with the US$ a touch weaker, crude is up $0.40/barrel, gasoline a touch weaker and US equities lower for the third consecutive day. Make what you will of that lot!

23 September 2015

  • The USDA’s ending stocks estimates for the 2014/15 crop year have been in a wide range over the last year. The peak stocks estimate in September 2014 was 475 million bu, with estimates steadily grinding lower to the most recent USDA forecast of 210 million bu. Crush and export totals have steadily moved up as world demand for US soybeans and meal exceeded initial USDA estimates, while annual residual rates have also increased following each quarterly stocks report. We estimate a 4th quarter residual of minus 129 million bu, with 1st September stocks at 221 million bu. The steady increase in annual residual suggests that NASS could cut the 2014 crop size (acres and yield).
  • US soybean crush and export use can be estimated fairly accurately based on weekly/monthly trade reports from the USDA – and the monthly crush data from NOPA. Combined June-August crush/export usage is estimated at 542 million bu. Total US quarterly exports are estimated at 96 million bu, a 67% increase from a year ago, but still an exceptionally low quarterly export rate as S America supplied the majority of June-August world soybean trade. US crushing margins remained exceptionally strong throughout the quarter due to another year of relatively high soybean meal prices that supported a record large June-August crush rate. Total soybean crush through the summer is estimated at 446 million bu, an historic 21% increase over last year, driven by a significant increase in domestic meal demand.

  • With supply, crush, and exports generally known, the final piece of the quarterly stocks calculation left to understand is the residual. We estimate an annual residual at 70 million bu, and based on the previous three quarters implies a 4th quarter residual of minus 145 million bu. If realised this would be a 45% increase in the number of “found” bushels over last year. The chart plots annual and 4th quarter residual, and note that over time, the number of found bushels in the 4th quarter has steadily increased. The trade expects that the large implied 4th quarter residual is an indication that NASS could lower the estimate for 2014 soybean production. But with large production expected, and carry in supplies to more than double, the reduced crop size will be viewed as insignificant to prices.

  • After yesterday’s dull and uninspiring session in Chicago we have seen active fund buying in wheat and soybean oil today. Dec ’15 wheat has moved above its 50 day moving average ($5.07/bu) and this has triggered further buying, which has also spilled over into European markets in London and Paris. The mid-September high of $5.03¼ also triggered buying and short covering when it was reached and breached. This, in addition to dryness in Russia and Australia, could well see us move into a market uptrend rather than the longer established downtrend we have been experiencing.
  • In a surprising move a vessel has been nominated to ship Brazilian corn into SE US. The surprise is that we are on the cusp of the US harvest “gut slot” and importing foreign corn in advance of the second or third largest crop on record feels strange to say the least! Argentine corn is offered at $160/mt and US Gulf is $175/mt, which equates to around $0.38/bu more. Ukraine has fallen to $159-$160/mt, cheaper even than Argentine supplies and $0.41/bu below US Gulf. Global cash prices are not following the Chicago move higher – yet, and this argues that Dec ’15 Chicago futures should struggle above $3.85/bu. If US Gulf is to compete globally, which means $165/mt or $4.20/bu, the equivalent Chicago Dec ’15 level needs to be $3.50/bu assuming global prices remain unchanged ($0.33 lower than today’s close).
  • The Brazilian Real has fallen further to 4.11 vs. US$. The lower levels are attributed to an impasse of the Congress to control their dramatically rising budget deficit. Impeachment of President Dilma is much more widely discussed, and no one truly knows quite how low the currency can go. Talk of Russian wheat sales into Brazil have been heard although many (including ourselves) question whether this is in fact the case. With the Argentine election imminent there is a strong suggestion that a reduction in export taxes could be on the cards as well as a sharp fall in the “blue” Peso. Brazilian buyers would doubtless benefit from waiting until the Argentine situation is clearer.
  • An interesting day when compared with yesterday!

22 September 2015

  • The significance of US crop ratings is dwindling as crops mature and harvest advances, but national soybean good/excellent ratings gained 2 points to 63%. NASS reported national harvest progress at 7% complete for the week, versus 3% last year and the 5 year average of 7%.
  • Corn yield reports remain variable, but there’s still no compelling evidence to suggest a national yield below 165 bushels/acre by the final count. Good/excellent ratings as of Sunday were pegged at 68%, unchanged for an 4th consecutive week. The crop condition yield model is also unchanged, and maintains a national final yield of 167-170. Harvest reached 10% complete, vs. 7% a year ago and 15% on average. Amid ongoing warmth and dryness, we fully expect the crop to be 35-40% gathered by the first week of October, just above the 5-year average.
  • US winter wheat planting is 19% complete, which is 10% above a week ago but down from 23% last year and a touch behind the five year average of 20%.

  • NASS will release its 1st September stocks report on the 30th, as well as its small grain summary, in which final wheat production is revealed. Our final 2015/16 US wheat production estimate stands at 2,163 million bu, up 27 million from NASS’s last estimate amid slightly higher spring and durum yields. Despite reduced imports from Canada, total US wheat supplies as of the end of the first quarter of the crop year are tallied at 2,946 million bu, up 286 million from a year ago and the highest since 2012. However, wheat futures are at multi-year lows due to slow demand rather than supplies. Notice in the table that Jun-Aug US exports at 184 million bu are the lowest since quarterly supply and demand record keeping started, while domestic use is up just 2%. The USDA is also likely overstating projected feed use.

  • US wheat stocks as of 1st September are pegged at 2,252 million bu, up 345 million (18%) from a year ago. Total consumption through the quarter is estimated at 694 million bu, down 59 million (8%) from last year. Recall the USDA projects total wheat use in 15/16 to be up 6% from the previous year! The graphic below, which includes 1st September stocks as a percent of June-Aug consumption, best illustrates the issue plaguing US wheat prices. Stocks are certainly higher than recent years, but 1st September stock/use at 3.24 rests at a 29-year high. Amid current world price relationships, which have changed very little in months, it will be difficult for the US to work through its building wheat stocks. Higher domestic use won’t be enough; exports of 1.0 plus billion bu in the next several years are needed.

  • Two words can describe Chicago markets today, dull and down! The Brazilian Real continues to fall reaching decades long lows vs. US$ and both crude and US equities are sliding on fears of rising interest rates despite poor global economic prospects. The decline in the Brazilian economy and rumours that a number of President Dilma’s key appointees are on the brink of resignation do little to add confidence. On the plus side, soybeans priced in Reals are at record high levels, and even though input prices (seed, fuel and fertiliser) will be more costly, the economics of agricultural production continue to look positive. Expansion in planted acreage looks even more likely, and substantial, and the global oversupply of grains and oilseeds seems irrelevant from the Brazilian grower’s perspective right now.
  • US and global grain export demand shows little signs of life in the face of the rapidly expanding US harvest and there is evidence that cash basis levels are coming under pressure. Monday’s gains are looking as if they will be short lived, and the prospect of a big volume Chinese soybean frame contract deal looks to be the only market supportive news right now.
  • Black Sea and EU sellers levels are pretty much unchanged amid limited demand. We understand that ant fresh tender of size would be aggressively pursued as export silos are full and sales need to be concluded in the near future in order to keep stocks moving.
  • Dull markets with limited physical trade suggest that we have not yet seen the lows!

21 September 2015

  • Chicago markets have made gains today led by wheat as discussions over dry conditions in S and C Russia grow. Winter wheat planting is under way and will pick up pace in coming weeks, and despite knowledge that spring weather is more influential than planting weather, the market is watching conditions closely. Also remember that funds still have a sizeable net short in Chicago wheat, which makes the market vulnerable to short covering rallies.
  • Outside markets have added support, crude has gained $1.40/barrel, gasoline has added $0.30/gallon today and equities have gained roughly 1% despite last week’s Fed pessimistic outlook for global growth.
  • Today’s announcement of 240,000 mt of soybean sales for 2015/16 delivery to “unknown” has also bolstered some support. It is likely that the buyer is China given the current Chinese delegation tour of the US. We would expect to see further sales announcements during the course of the week.
  • There is no news over changes to the Russian wheat export tariff or intervention prices, despite anticipation of imminent announcements.
  • The Brazilian Real continues to struggle with rates slipping to 4.1:1 vs. US$. Soybean plantings continue in mild and dry weather this week in the aftermath of mid-September rains that bolstered soil moisture levels. Rains are forecast to return in the 8-15 day timeframe, normal for this time of year and conditions are viewed as generally favourable.