12 March 2015

  • The USDA has today released its weekly export figures as detailed below:

Wheat: 493,200 mt, which is above estimates of 300,000-450,000 mt.
Corn: 514,300 mt, which is below estimates of 600,000-800,000 mt.
Soybeans: 198,700 mt, which is below estimates of 300,000-500,000 mt.
Soybean Meal: 101,800 mt, which is within estimates of 50,000-200,000 mt.
Soybean Oil: 4,600 mt which is within estimates of zero-15,000 mt.

  • Brussels issued weekly wheat export certificates totalling a massive 1,643,824 mt, which brings the season total to 24,254,391 mt. This is 1.788 million mt (7.96%) ahead of last year’s record pace. The volume is the second highest weekly total this season, marginally behind week ending 3 February which saw certificates totalling 1.707 million mt.
  • The seasonal switch of international trade away from the US and into S America is evidenced by the drastically reduced US soybean export figures, which were below even the lowest estimated levels. We would expect ongoing US soybean export sales to be minimal for the remainder of the season as Brazil picks up the slack and Argentina, if it ever truly pulls its socks up, to follow as their harvest gets under way. We note from the latest data that one US soybean cargo has been switched to  S America, and that there are 656,000 mt of “optional origin” sales outstanding, all of which could be vulnerable to switching purely on economic and financial grounds (S America is cheaper). A rumour is circulating that a US cargo of soybean meal, destined for the EU has been switched to cheaper Brazilian supplies. Like soybeans, outstanding US meal sales include a record large 825,000 to “unknown” destinations and there looks to be a growing possibility that these are vulnerable to switching as well. Any switched volumes will have to be added back to US end stocks, which is why we commented accordingly on the USDA figures earlier in the week.
  • In Arkansas, in the US, it has been confirmed that the H5N@ strain of avian bird flu has broken out on a turkey farm. Fears of the virus being spread by migratory birds are growing and a spread into the broiler industry cannot be ruled out as the migration season is under way. The potential for restrictions on exports if there is any spread of the virus should also be borne in mind, and the impact on feed consumption is not minimal given that 14% of turkey and 19% of broiler production is sold overseas. Poultry producer’s margins have been sufficiently buoyant to suggest that early or precautionary culls are unlikely at this time.
  • Further suggestions that Brazilian truckers are to resume their blockages have been rumoured although not confirmed. Our contacts advise that any further action is likely to be non-organised, sporadic and with limited impact at this time, but the political protest scheduled for Sunday could possibly re-ignite the issue – watch this space!

11 March 2015

  • As is often the case, post USDA report trading has presented something of a conundrum. Yesterdays trade ended with something of a rally and, yes, there was some Chinese short covering in soybeans and meal, but the report held little, if anything, to justify a rally. Even the US$ sharply higher, again, should logically point towards a “sellerish” feel to the markets.
  • Perhaps there is a lingering unease over the Brazilian situation with a national day of protest scheduled for the weekend (Sunday), or maybe there is a return of fund monies in the aftermath of recent volatility in US and world equity markets. Regardless, there is little that we can point a finger at with certainty to explain the post report solid feel to the markets. Dollar strength, with 12 year highs being hit this morning and the €uro declining to $1.05 as well as crude oil and gold giving back early gains did little to direct the ags lower. One factor that has maybe triggered short covering in wheat is nervousness over continued dryness.
  • Our considered view is that there is nothing fundamental to justify the recent upswing in prices, and that we are seeing a selling opportunity as further price advances appear to have little of substance behind them.

9 March 2015

  • Today (and likely tomorrow morning) was always going to be about tomorrow’s USDA report, Brazil’s CONAB report and the outcome of discussions between truckers and the Brazilian government. Consequently the vigour of downward price action in recent days has given way to some profit taking and risk-off mentality that has permitted the market to close higher, albeit off the highs of the day.
  • In Brazil there has been a further threat of transportation blockages although many believe that this is a measure designed to turn up the heat in advance of negotiations/discussions tomorrow. The Brazilian Real has fallen to 3.1 vs. US$ and we have heard that farmers are upping their selling on the US$ rally. The last week has seen a considerable volume of soybean movement across S America, the advance of the Brazilian harvest doubtless prompting cash selling.
  • In wheat we are aware of market concern over dry conditions across the US Plains, EU and parts of Russia. Whether this is justified at this time, given that much of the crop area is still in dormancy, remains to be seen. Suffice to say recent downward price pressure has been enough to allow the bulls a run at this one, any lingering threat of ongoing dry conditions could become an issue, so this is one to watch in coming days and weeks as the crops require an increasing precipitation volume during early vegetative growth stages.
  • Stratégie Grains have updated their UK cereals output figures and state that in general winter cereal crops are in “very satisfactory” condition. The mild winter with generally above average temperatures have aided development, they said. It was also noted that spring planting was just getting under way. The UK wheat crop was reduced by 80,000 mt to 15.014 million mt compared with the mid-January estimate, and compares with 16.606 million mt in 2014. Area sown is down a touch and yield was forecast a touch higher although it remains early to be certain on the latter point.
  • We expect trade to remain somewhat subdued in advance of the USDA data, scheduled to be released at 4pm UK time tomorrow, and our view is that we are unlikely to see any significant or startlingly bullish data. If this becomes the case we would expect to see a resumption of trend as the week progresses.

6 March 2015

Friday morning musings……

Global currencies remain depressed at multi-year or record lows vs the US dollar. Stated another way, the US dollar posted new 10-year highs this week. As for ag commodity markets in various currencies, Chicago corn, wheat and soybeans have performed the worst. Corn is down 21% from last year; wheat is down 25%; soybeans are down 33%. This year’s decline, as well as lower projected prices in 2015, was cited in the reduction in farm income and acres revealed by the USDA’s 2015 Outlook Conference. Outside the US, the decline in price has been much more subdued – or even reversed. Soybeans in Brazilian reals are down just 14%, which is comparable to $12.50/Bu. Russian wheat is up 25%, comparable to $8.00. Aussie wheat is down 13%, comparable to $5.50. Ukrainian corn is nearly double March of 2014 – comparable to $9.00/Bu. We should be mindful that non-US producers will be more willing sellers relative to their US counterparts amid better local currency values.

This week it was reported that US crude oil stocks are record large for late February – and still growing. The chart below reflects that crude oil bounced off a weekly uptrend line that connects the 1998, 2002 and 2009 lows (long term support?). The break in 2009 was produced by a sharp contraction in US domestic demand, while the bottoms in 1999 and 2002 were on an abundance of supply. There is a possibility that the trend-line could be broken in the next few months with spot oil dropping to test the 2009 lows at $32.50.

5 March 2015

  • Wheat and soybeans in Chicago are lower this evening and the wheat corn spread, which was at well over $2.00 not so very long ago, is all but a dollar today! How things change and wheat is pacing the decline today reaching five month lows.
  • The USDA has today released its weekly export figures as detailed below:

Wheat: 507,600 mt, which is within estimates of 350,000-550,000 mt.
Corn: 986,800 mt, which is below estimates of 700,000-1,000,000 mt.
Soybeans: 501,200 mt, which is above estimates of 300,000-500,000 mt.
Soybean Meal: 158,600 mt, which is within estimates of 50,000-225,000 mt.
Soybean Oil: 5,600 mt which is within estimates of 5,000-20,000 mt.
There was little, if anything, to raise an eyebrow over in the sales data.

  • Brussels issued weekly wheat export certificates totalling 551,358 mt, which brings the season total to 22,610,567 mt. This is 737,869 mt (3.4%) ahead of last year’s record pace.
  • Our understanding is that Brazilian farmers have been active cash sellers of soybeans today as the Real crept higher hitting 3.1 vs US$ – talk of ½ to 1 million mt sales are rife.

5 March 2015

EU Wheat Evaluation

European exporters have flooded the market this year, following a sizeable surplus for the second consecutive year. How long will the EU remain a top exporter? In the table below, it is assumed acres are steady, trend yield and a slight boost in domestic use. Without a major weather problem in the next 2-3 months, Europe’s surplus looks to persist. This is partially a function of 5-year high carryin supplies. Spot Chicago futures are down 24% from March ’14. EU futures, however, are down only 14% as the €uro has struggled in the last three months. This has been a dominant theme in non-US markets: weaker currencies are partially – or more than fully, as in the case in the Black Sea – offsetting sharply lower CBOT prices. Lower EU wheat production in 2015 will be a function of yield rather than acreage.
EU Wheat Supply/Demand Balance:
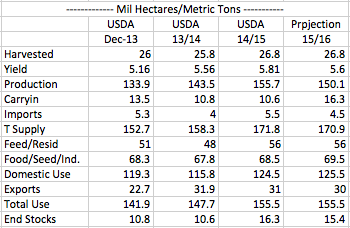
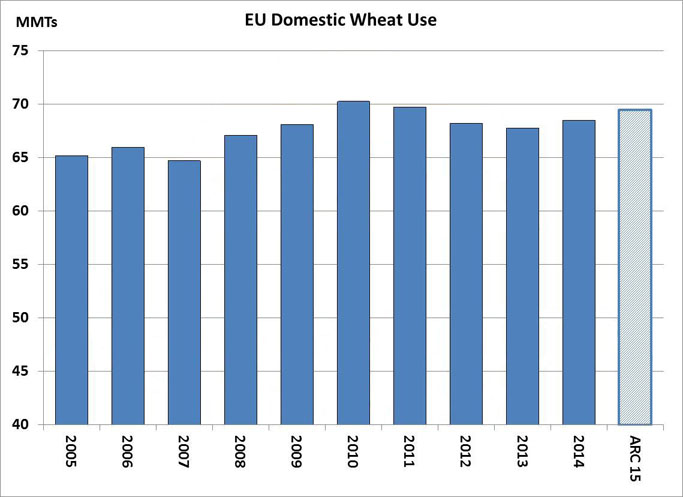
Projections show total European domestic wheat use in 2015 at 125.5 million mt, up 1 million mt from 14/15 and the highest since 2011. But notice in the graphic that domestic use has been rather stagnant in recent years. Since 2008, domestic wheat use in the EU has fluctuated in narrow range of 67-70 million mt, and gains in production have spilled directly into the export market. As of now, European exporters are trying to find any remaining old crop wheat demand to alleviate the projected 60% build in stocks – but to no, or at best limited, avail. Assuming production of 150 million mt in 2015 (unchanged seedings, trend yield) record exports are needed for sub-15 million mt ending stocks. And the European market in recent years has shown little concern over tight stocks/use ratios.
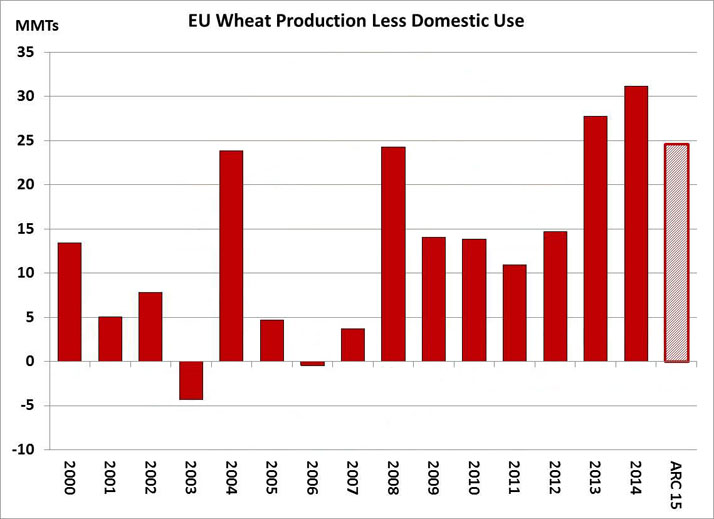
The initial new crop EU balance sheet features production 25 million mt above domestic consumption, down 6 million mt from last year. But this will be offset exactly by higher carry-in stocks, and so EU exports of 30 million mt in 2015 appears a reasonable estimate. Note also that Russia’s available surplus in 2015 is initially projected at 20 million mt. (Like the EU, lower Russian production in 2015 will be mostly offset by higher carry-in supplies.) Combined EU and Russian available exportable wheat supplies in 2015 are projected at 50 million mt vs. 51 million mt in 14/15. The US will again be a modest player in the world wheat market, and US offers must be much more competitive in the coming crop year to boost global market share. More and more work implies that highly adverse weather is needed to trigger any lasting rallies in the grains beyond periodic short covering.
4 March 2015

  • A “down day” today with some sharp losses seen in Chicago across the board. Brazilian truckers have said they are focussing on the capital city, Brasilia, in the hope of cutting a better tax deal on diesel, and this has eased problems and ports are reporting growing truck lines awaiting discharge.
  • Russia’s AgMin have increased their 2015 grain production estimate to 100 million mt, a mere 4 million mt below the prior year, and an improvement on the 85-100 million mt range previously quoted. As always, caution should be the watchword when factoring statements from Russia! Improved weather is the key behind the higher numbers, and if it persists we could see late June marking the end of the export tax. The potential for a big old crop carryover should not be forgotten, and that will doubtless impact new crop price structures. Our thoughts, at present, centre on the fact that winter sown crops are not yet out of dormancy and spring crops not yet planted – how and why has the position become more favourable all of a sudden?
