30 April 2015

  • CBOT markets, with just under an hour to go, have all moved into the red as an early rally failed ostensibly on news that the Argentine government called an end to the transport and crush strike, which put support into markets yesterday. The treat by the government to take assets from crushers and exporters in a bid to keep product flowing demonstrates quite markedly how intent they are on ensuring revenues continue to accrue from export taxes. On the back of the news the bulls rushed for the door marked “exit” and focus returned once again to plentiful old crop stocks and favourable new crop growing conditions.
  • Global FOB grain prices have pushed to fresh lows in Black Sea and S America with offers for both wheat and corn at 12 month lows. Exporters are pricing in an effort to search for demand, which remains limited at present.
  • The USDA has today released its weekly export figures as detailed below:

Wheat: 403,700 mt, which is above estimates of zero-100,000 mt.
Corn: 945,800 mt, which is above estimates of 500,000-700,000 mt.
Soybeans: 314,900 mt, which is above estimates of 50,000-250,000 mt.
Soybean Meal: 137,200 mt, which is within estimates of 100,000-200,000 mt.
Soybean Oil: 31,800 mt which is above estimates of zero-20,000 mt.

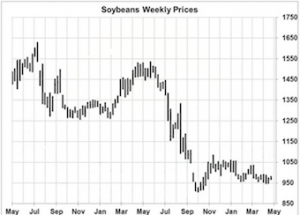
  • Interestingly the above figures mask a key piece of data, that being current year (old crop) wheat sales were a net minus 449,200 mt, which reflects record cancellations for the week. (New crop soybean sales were also negative). The old crop wheat news was hardly a bullish input to the market and together with falling world FOB levels and the likely removal of the Russian export tariff paints a bearish picture and has helped to push prices more that 2% lower. In the absence of S American export delays we look for CBOT soybeans (basis July ’15 contract) to retest the $9.50 lows set on 10 April.
  • Brussels has issued yet another ½ million plus weekly wheat exports with this week’s total hitting 634,021 mt, which brings the season total to 29,327,748 mt. This is 2.76 million mt (10.37%) ahead of last year’s record pace.
  • An interesting scenario is starting to unfold as Senalia, the major Rouen based export silo and delivery point for Matif wheat, announced tonight that it was halting wheat intake until further notice due to lack of vessels and/or load out programme. The silo has a capacity of around 250,000 mt and open interest on May ’15 Matif wheat, which expires 11th May, is 24,000 contracts (1.2 million mt). Given this news and the two month high in the €uro as well as the fall in Chicago it has to be noted that Matif wheat’s performance today is difficult to fully comprehend.

30 April 2015

  • We continue to hear talk about US and world crop sizes these days as a new Northern Hemisphere growing season really gets going. Big crops are always said to produce lower prices.
  • Our concern is not the size of crops, but the lack of US and world grain demand growth!
  • US and world bio-fuel demand growth is mature – and no, or extremely limited, growth is foreseen.
  • US corn export demand has been stagnant for decades – and unlikely to enlarge substantially until China becomes a sizeable importer, or we see a considerably weaker US$ restore competitive prices from the US.
  • We therefore see stable total US corn demand in the order of 13.3-13.7 billion bu for years to come – a big worry as US and world trend yields rise.


29 April 2015

  • Russia’s Deputy Prime Minister Dvorkovich has today said that the wheat export tariff can be removed before July 1st, and the latest update suggests that a mid-May date could well be agreed upon. Grain brokers were immediately attempting to drum up business as one would expect from the broking fraternity!
  • CBOT markets opened somewhat softer but a fire at the Dreyfus Argentine grain export facility and a threatened Argentine crush strike have both conspired to put some support into the market.
  • Argentine farmers are, at last, moving volume soybeans as harvest passes the 60% mark utilising delayed pricing options. The methodology allows soybeans to move into the supply chain and be utilised, and be priced at a much later date.This has appeal to farmers as the physical storage risk in farm bags is much higher that the paper risk utilising the option market. This is actually helping to push physical movement in Argentina right now.
  • It is worth noting that the Brazilian cash market saw FOB basis falling on the back of volume selling whilst Argentine levels held steady. Consequently, Argentina is now the world’s lowest cost seller by some way and S American beans are priced below US Gulf well into September.
  • Other fresh news is limited.

29 April 2015

  • Funds can be right!
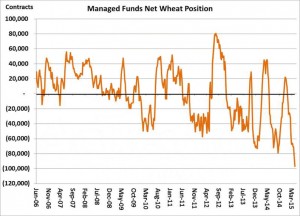
  • Notice in the chart below that funds are sitting on a record net short US wheat position (as we have previously reported) and that futures contract prices continue to decline – to levels not seen since 2010! This means that funds are profiting from their bearish wheat stance.
  • Funds have generally been short wheat since the drought of 2012. This is a big change in their positioning from 2006-2012. Either funds have a macro sense of how to position, or they pay attention to world wheat fundamentals.
  • For whatever reason, funds now want to be short the grain/soy markets and rallies only occur amid unforeseen fundamental sparks.
  • Moral of the story – watch out for unforeseen fundamental sparks!


28 April 2015

  • Today has seen soybeans putting in a strong(ish) performance much of which is attributed to badly positioned long corn/short soybean trades. The soybean/corn spread was a much touted trade with 2015 corn acres estimates at 88 million (or lower) and soybeans at 87 million (or higher). Today’s rally has triggered some buy stops and funds have followed according to our sources.
  • In contrast wheat pushed to new year lows as Black Sea prices continued to display weakness on a FOB basis, although prices have moved higher into the close. The Russian export tariff continues to be discussed, with the latest rumour suggesting that the tax could be lifted as soon as June 1st. Key players are waiting for formal confirmation before making decisions – a wise move in our opinion!
  • The EU parliament voted in favour of a cap at 7% on first generation biofuels (those based upon grains, sugar, veg oils etc) with the possibility of lower levels at national level. One commentator suggest that 2015 will see biofuel incorporation at 4.6% at an EU level with 5% for bio-diesel and 3.4% for bio-ethanol. It is not expected that the outcome of the vote will make any market moving impact.
  • US weekly crop conditions and progress show winter wheat rated as good/excellent to be 42%, which is unchanged for another week. Spring wheat is 55% planted, up from 36% last week, 17% last year and compares with the ten year average of 29%. Corn was reported to be 19% planted, up from 9% last week and 17% last year, and compares with the ten year average of 25%.
  • As an aside, US spot CBOT oat futures have fallen to their lowest level since 2010. The monthly oat chart below reflects the sharp fall in oat prices in recent months as producers shed old crop stored supplies and end users await new crop supply. The next downside price target rests at the monthly trendline at $2.09 which would nearly reach the 2010 lows. Long time grain traders argue that oats lead the CBOT. We are not sure of that direct correlation, but freely admit that commercial oat participation makes this grain a lead indicator. Oats and wheat are both trending lower and without adverse world weather, bottoms are not expected until June.


27 April 2015

  • We start the week with an update from the European Commission’s Monitoring Agricultural Resources (MARS) Unit which is forecasting 2015 soft wheat yields within the EU at 5.89 mt/ha This is up 0.1 mt/ha month on month and some 3.7% above the five year average. Barley yields were also seen higher from a month ago at 4.71 mt/ha, which is up from 4.63 mt/ha, again an upgrade on the five year average. Rapeseed yields were also higher at 3.35 mt/ha, up from 3.24 mt/ha month on month and almost 7% above the five year average. Favourable conditions were cited as the main reason for yield improvement with temperatures some 2℃ above average as well as soil moisture conditions described as “satisfactory”, although caution was raised over the potential for drying soil moisture levels unless rainfall is forthcoming.
  • Grain markets have started the week lower (with an hour to go in Chicago) whilst soybeans have moved into positive territory. Corn and wheat have both touched 2015 lows as soybeans picked up on fresh export demand as well as the unwinding of long corn/short soybean spread trades. The USDA reported the sale of old crop soybeans, suggested to Indonesia who like the colour for tofu production, and it is suggested that these will be rolled to a new crop position – at a discount. China continues to attempt to roll Brazilian cargoes forward as they struggle to deal with their current oversupply position and utilise today’s rally to facilitate this. Any Chinese buying is likely to be from the US for Oct-Nov positions.
  • Perhaps of more concern is news that China is checking DDG and barley/sorghum cargoes more carefully for pesticides and residues in what looks like another attempt to shut out foreign grain supplies once again. This fit sin with timing of their own domestic corn auctions which are designed to reduce the huge government stocks. It should not be forgotten that in early May last year China was playing phytosanitary “games” with DDG and corn imports and cargoes using non-approved GM traits as the excuse!
  • Strong rumours are circulating that Russia will end their wheat export tariff before 1st July on the back of favourable new crop development, as well as the appointment of a new agri minister. It has been suggested that a decision could be made by mid-May, and there is much lobbying by international grain traders based upon what is perceived to be a huge backlog of old crop supply.

26 April 2015

Weekly CCI Analysis:

The CCI Index has been consolidating in a rather narrow range for the past 6 weeks. News that China had cut its banking reserve ratio and that the US Fed was unlikely to raise interest rates in September could not sustain a recovery. Gold, grains and tropical markets declined. The week’s bullish stalwart was crude oil as it powered to its highest price since November. Research signals that above $60.00 new money will be poured into fracking wells and that those wells that were mothballed due to lack of profitability will come back on line. We doubt that crude can sustain a recovery and would favour selling late summer crude oil contracts near or above $60.00. Further research calls for a top in the CCI index in early May with a seasonal decline into late summer.

Longer-term soybean analysis:

The soybean market traded moderately higher through most of the week with support offered from fund short covering. No changes for the US supply/demand outlook were offered, but the market was focused on the threat of a Brazilian trucker strike and the potential impact on Brazil’s export ability. The strike was ultimately a non-event with regard to world export flows and soybean futures eased back to unchanged or lower by Friday’s close. Market focus going forward will be on US planting progress and the extended weather forecasts. The forecast into early May is supportive for timely plantings through the Delta and Midwest. Our market outlook remains bearish with a view that November soybeans could fall to $7.50-8 at harvest given a normal growing season. Our initial target for July rests at $9.00 and then $8.50.

Longer-term corn analysis:

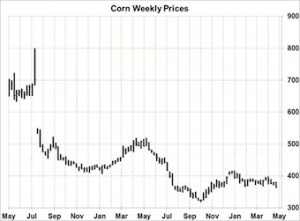
CBOT corn fell 15 cents this week as the market’s confidence on a warmer and drier Central US pattern beyond early next week is rising. July corn has fallen below key support at $3.75, with next meaningful support targeted at $3.50. Fresh news continues to be bearish. In additional to technical weakness, a lasting period of warm/dry weather is scheduled for April 28-May 5, during which a majority of the US crop will be seeded. NOAA’s (The National Oceanic and Atmospheric Administration) outlook for the month of May features near normal temps and precipitation. Of course El Niño has been is established, which in recent decades has been highly favourable for N Hemisphere grain yields. A weather story is lacking. Longer term, with another large non-US surplus probable, the US market will have to buy back world trade via cash prices. The Dec ’15 contract holds some $.50-.80 of weather premium, which will erode slowly with a major US weather pattern shift in June/July. A “sell the rally” mentality will persist without adverse weather.

Longer-term wheat analysis:

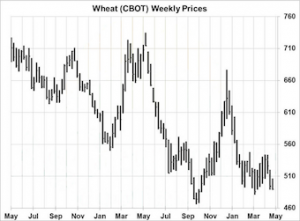
US wheat futures ended mixed. CBOT contracts fell 8 cents and are testing Feb’s lows; KC wheat fell 5 cents on the recent boost in Plains soil moisture, with additional light showers projected across KS and OK into early May. Spring wheat ended steady amid ongoing dryness across ND and MN. Our outlook remains unchanged, and rallies in the coming weeks offer selling opportunities. Winter wheat crop improvement is noted across the whole of the Northern Hemisphere, and with El Niño to build into summer we doubt that lasting heat or dryness will develop. Black Sea exporters will be even more aggressive as and when the export tariff in Russia is lifted, and the dominant theme of the markets is that US wheat remains completely uncompetitive. Lows in world FOB markets this summer are projected at $165-175/MT, and $4.25-4.50 CBOT wheat is needed to compete globally. Russia may have a record exportable surplus this year at over 25-28 MMTs.


25 April 2015

  • Earlier in the week we mentioned the El Niño phenomenon, for the probably the first time this season, and it appears that it is gathering considerable momentum in the equatorial Pacific and should be in “full bloom” by late summer. There have been 9 other US growing years (excluding last year since El Niño faded) that US crops developed during an El Niño cycle. The chart to the below reflects corn and soybean yields from those El Niño growing seasons. Note that the biggest yield declines occurred in 1981 in corn and 2002 in both corn and soybeans – that posted yield losses of 5-6%. All other years posted yield gains of 1-14% with a record corn yield set in 2004. The point is that El Niño years do not always produce high or record yields, but that the chances of a dire drought occurring are substantially reduced. The odds are low that the 2015 US corn yield will drop below 160 bu/acre thanks to El Niño.


23 April 2015

  • We have seen modest gains today as funds have been buyers in corn, wheat and soybeans and a limited number (13 according to one source) of road blocks have appeared in Brazil. Around a third of the roadblocks are in Mato Grosso where the soybean harvest is complete, port activity is normal yet the speculative community have decided to cover some short positions. As always, time will tell as to whether the strike builds or falters.
  • Outside markets in the US$, which is down 1%, crude oil which has rallied $1.80/barrel to new multi-month highs and gasoline futures that are testing $2.00/gal have all added some support to a market which continues to lack any fresh fundamental input.
  • The USDA has today released its weekly export figures as detailed below:

Wheat: 524,400 mt, which is above estimates of zero-100,000 mt.
Corn: 874,100 mt, which is above estimates of 400,000-600,000 mt.
Soybeans: 110,200 mt, which is within estimates of minus 100,000-plus 150,000 mt.
Soybean Meal: 130,200 mt, which is within estimates of 50,000-150,000 mt.
Soybean Oil: 4,400 mt which is within estimates of zero-20,000 mt.

  • Brussels continued its pattern of large weekly wheat exports with this week’s total hitting 757,852 mt, which brings the season total to 28,693,727 mt. This is 2.62 million mt (10.03%) ahead of last year’s record pace.
  • StatsCan’s latest report shows 2015 Canadian wheat seedings up 3.9% to 24.8 million acres vs. 23.8 million in 2014. Conversely 2015 canola seedings were down 4.5% at 19.4 million acres vs. 20.3 million a year ago.
  • Further statistics today came from the IGC who raised their estimate for 2015/16 global corn output by 10 million mt to 951 million mt, which is lower than the previous year’s record 994 million mt crop. Global wheat production for 2015/15 was cut by 4 million mt to 705 million mt with downgrades in Argentina, China and India, and compares with 721 million mt the previous year. Despite the reduction in estimates and year on year output, the IGC commented that total grain output would still be around 3% above the five year average, which reflects mostly favourable growing conditions in key areas.
  • To make a general summary, the EU and Black Sea wheat surplus appears to be growing and there is not currently and weather issue to spark significant short covering which could spike prices. In corn the US weather is trending warmer and drier from next week which will speed planting, and as we have suggested, corn does not have a pressing demand story. In the absence of a weather issue any upside looks limited at this time.In soybeans we are seeing some uplift in prices from the Brazilian trucker’s roadblocks but in our view this is of limited longer term impact. In the face of normal weather it feels as if the world is awash with soybeans. Chart technicals are providing support – for now, a short covering bounce can not be ruled out but the fundamentals continue to point lower.