11 June 2015

  • In a broad sense, the USDA June NASS and WASDE reports held few surprises! Traders will now look to the NASS June 30th Stocks & Seeding report and US/world weather for price direction. It’s all a question of new crop supply. The June Stocks report will likely report a sizeable rise in US corn and soybean end stocks from prior years, but it is seeding changes that will garner all of the market attention. Will 2.4-3.2 million acres of Prevent Plant acres get seeded this year when compared to 2014? It has been a nice spring for seeding across much of the Central US (except for KS/MO). Even in the Plains, producers tell us that they are going to utilise all of the soil moisture and seed additional acres to sorghum/soybeans. Sharp falls in 2015 US corn, soybean or spring wheat seeding are not expected to be uncovered on June 30th. If there was a surprise in the June WASDE report it was that 2015/16 US biodiesel demand was not raised substantially! WASDE estimated 15/16 US biodiesel use at 5,100 million pounds, a 2% increase from May. Such an increase, with WASDE having time to fully analyse the impact of the new EIA RFS proposal, was disappointing. Such a soy oil production increase would only require an additional 8.7 million bu of soybeans! Also, Black Sea and European total 2015/16 wheat supplies will be equal to or above last year. There will be no shortage of world wheat with major world exporters all competing for trade that is not any larger than 2014/15. For a lasting trend change in world/Chicago grain/soy prices requires adverse weather. Normal weather will produce a grind lower into late July.
  • The USDA raised both old and new crop US corn stocks. In old crop, this is a function of lower projected ethanol use, which in turn is a function of this year’s surge in ethanol yield (2.85 gal/bu, vs. 2.74 in 2014). New crop stocks were hiked amid larger carryin supplies. Season average price forecasts were left unchanged. Major balance sheet changes await the June Stocks report due at month end, but we still view the USDA’s total old and new crop consumption estimates as overstated. The pace of old crop export sales has been fading rather quickly in recent weeks, while a surge in S American production this year will limit export demand through the Aug-Jan period – and new crop exports are projected to be down noticeably from the current year. Remember that feed/residual is tracking well below the USDA’s forecast for two quarters, and a demand led bear market remains intact. 2015/16 end stocks of 2.364 billion suggest harvest prices of $2.90-3.10.

  • The world balance sheet changes that provided the catalyst for weaker CBOT corn trade on Wednesday:
  • The USDA increased Brazil’s harvest to 81 million mt, up 3 million mt from May following ongoing rains in early May – and better than expected yield reports. Similarly good weather sparked a 0.5 million mt hike in Argentina’s crop. And new crop Russian production and exports were raised 1 million mt amid a surge in seeding in Southern Russia. USDA boosted old and new crop world trade to account for record total supplies in major exporting countries, but it’s still giving the US too much market share. Gulf corn is not competitive beyond July – even into traditional destinations – and rather than build stocks to a record 20 million mt, we expect Brazil to be a dominant exporter in the Aug-January period. Total Black Sea supplies are projected down just 0.5 million mt from 2014/15. All of this leads to a highly competitive world corn trade in 2015, which is not bullish for futures prices or fob premiums. Adverse weather is required to lift Dec corn above $3.90 for any length of time. Also do not underestimate the impact of corn upon wheat markets!

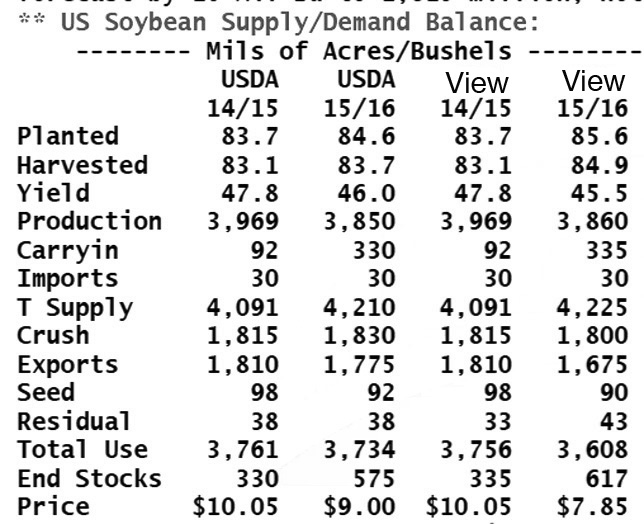
  • The USDA made a few minor tweaks to the soybean balance sheet estimates, but the final message was left unchanged: old crop soybean supplies through to the end of the year will exceed that which is demanded, while stocks will further inflate next year! In the old crop balance sheet the USDA raised the crush forecast by 10 million bu to 1,815 million, noting better than expected domestic soymeal disappearance, while exports were also increased by 10 million bu to 1,810 million. Stocks were thus reduced by 20 million bu to 330 million bu and the season average price was lowered by a nickel to $10.05/bu. In the new crop, there were two minor adjustments. The first was the lower carry in, while crush was increased by 5 million bu to 1,830 million. End stocks were lowered by 25 million bu to 475 million and the season average price was unchanged at $9/bu. The report was anything but bullish, and we expect that NASS will find another 1 million acres in 2015 US soy seeding.

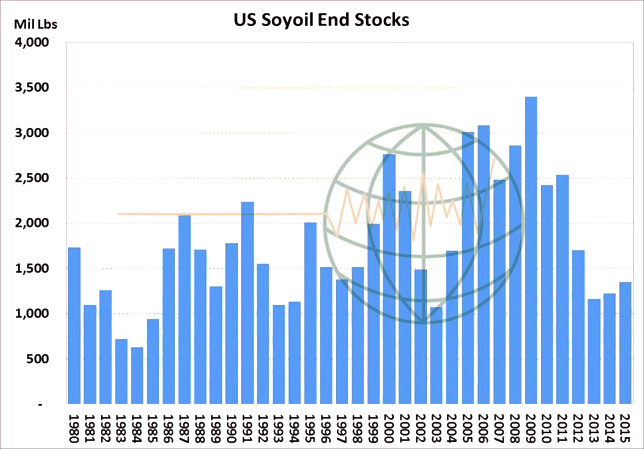
  • In the soy product balance sheet, both meal and oil production increased due to the larger crush forecast, while old crop meal exports were lowered by 100,000 short tons to 12.7 million tons. The soybean oil yield was lowered fractionally while imports increased by 25 million lbs to 225 million. The USDA increased biodiesel use by 100 million lbs to 4,900 and food/feed/industrial use increased by 50 million lbs. Year end old crop stocks were lowered by 15 million lbs to 1,225 million and the season average price increased a penny to 33 cents/lb. In the new crop balance sheet the USDA raised biodiesel use by 100 million lbs to 5,100 million. Food/feed/industrial is expected to remain unchanged from 2014/15, though the FDA is expected to release it’s final decision on a trans-fat ban next week. This could have major impact on domestic food use going forward. The season average price forecast range increased by a penny to 30.5-33.5 cents, which should cap new crop soybean oil rallies at 35-36 cents. July soybean oil above $.34 looks fully priced.

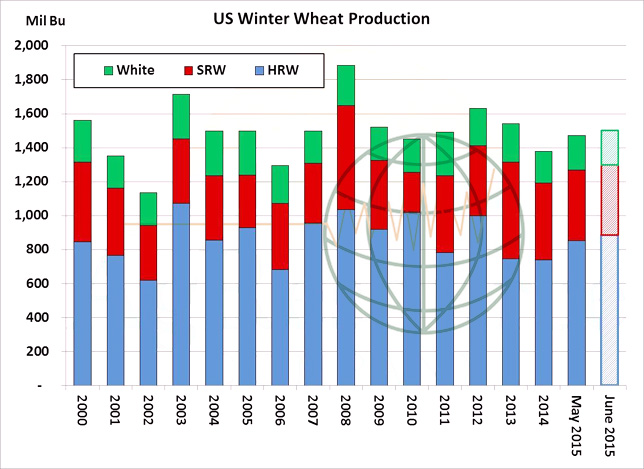
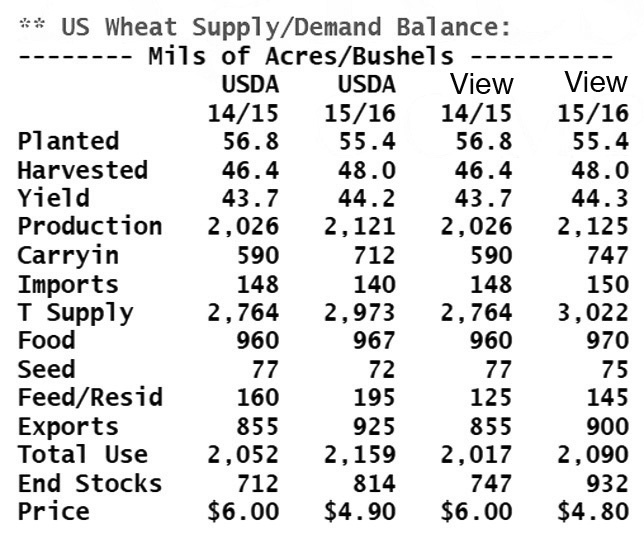
  • NASS lifted US winter wheat production 33 million bu to 1,505 million, well above prior trade expectations. This is largely a function of a bigger projected harvest in KS, where recent rainfall has been helpful and will at least add to quantity. The KS crop was increased 43 million bu to 315 million. Other minor boosts are noted in MT, NE and CO, which offset reductions of; 3-11 million bu in OK, SD and TX. Total HRW production is pegged at 887 million, up 34 million from NASS’s estimate in May. SRW production is estimated at 414 million, down 2 million from previously. Winter white is estimated at 204 million, up 1 million. Of note, without improved exports – which are unlikely amid heavily overvalued fob premiums – HRW stocks in 15/16 will surge to 420-430 million bu, vs. 282 in 14/15 with stocks/use projected at a record 55%.

  • The USDA in its all-wheat balance sheet raised old crop stocks 3 million bu amid slightly reduced exports. New crop stocks were lifted 15 million bu to 814 million. The USDA has acknowledged the potential for reduced quality across the S Plains, and so boosted feed use 15 million bu, which was not enough to offset higher production and carry-in supplies. We await the June stocks report for final end stocks confirmation, but we expect feed/residual use to be revealed some 70 million bu below the USDA’s estimate. New crop exports are overstated – perhaps significantly so – amid a slow pace of sales to date and no sign of competitive Gulf offers into September. Sub-$5.00 wheat will likely return in the weeks ahead, and the USDA’s world balance sheet adjustments confirmed that the US will be a very modest world player in 2015. US end stocks will approach 1.0 billion amid lacklustre exports and with favourable N Plains weather.

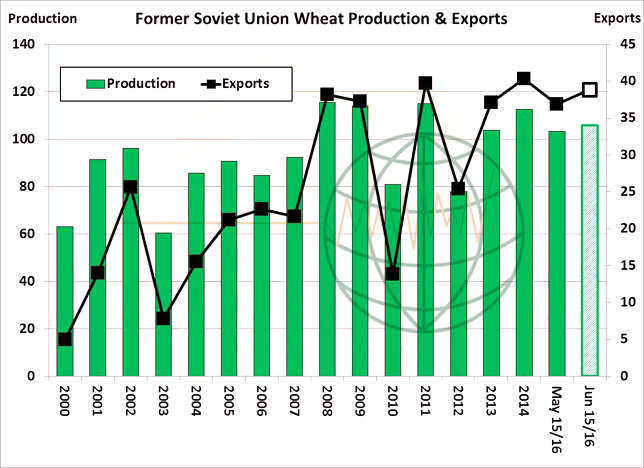
  • World wheat production in 15/16 was raised 2.6 million mt to 721.5, while total consumption was raised 3 million mt. Total global wheat stocks are pegged at 202.4 million mt. This is down 900,000 from May but is 2 million mt above 14/15 and is the highest since 2001. The highlight of the world numbers is a 2.5 million mt increase in Black Sea production (1.5 million mt in Russia, 1 million mt in Ukraine), most of which was put into exports. Total FSU production is projected at 106 million mt, down 6 million mt from 2014. However, amid larger carry-in supplies, total FSU wheat supply is down just 3 million mt from last year. Exports are pegged down only 1.5 million mt. Such a Black Sea surplus implies that fob offers there will range from $180-195/mt into early autumn. This is equivalent to $4.40-4.70, basis spot CME. Major exporters will again have ample surpluses in 2015, which will work against sustained rallies in the US. A test of recent lows is expected during harvest.

10 June 2015

  • The June crop report held little in the way of surprises and markets have closed lower with wheat leading the way lower, CBOT wheat closed around 3.5% lower amid the expanding harvest and improved prospects for needed rains across parts of the EU and Canadian wheat growing areas.
  • Corn and soybeans followed wheat lower and it will now be weather (which will impact supplies) that will drive CBOT prices in the run up to the 30 June stocks and seedings report.
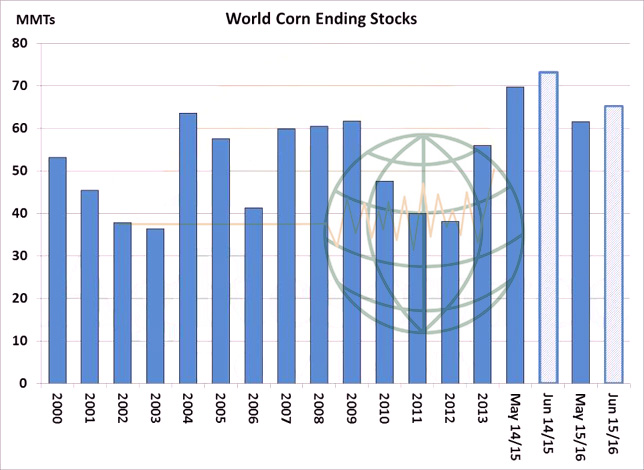
  • One surprise came in the shape of the 5 million mt of 2014/15 corn stocks which were “found” raising stocks to the 2nd highest level on record at 197 million mt. It was in1986 when global corn stocks reached a mammoth 204.8 million mt.
  • It appears that the world is heading for a record combined stockholding of wheat, corn and soybeans in 2015/16 whilst US combined stocks will be heading towards a record level too. As Chinese soybean meal prices continue to hover around eight year lows and they are making little impact in the global market it is hard to forecast higher prices unless we see a severe (and totally unexpected) drought.
  • Wheat looks like a definite “sell”, and it really feels as if nearby soybeans will struggle to hold current price levels on the back of the largest US stocks in some nine years.
  • To download our USDA Recap please click on the link below:

USDA Recap 10 June 15


10 June 2015

  • Canadian Canola futures have rallied to yearly high with a noticeable push seen in the last week. Canola stocks were already tightening amid slightly higher than expected crush and lower expected new crop planting intentions. The EPA’s proposal for higher biodiesel blending, and recent frost/freeze damage have exacerbated the rally. We have adjusted harvested area and yield to levels slightly below the USDA’s forecast in May due to a late May frost. Notice how sensitive Canada’s canola balance becomes for 2015/16! Harvested area is projected at 7.4 million ha, down 300,000 from USDA. Yield is pegged at 1.85 mt/ha, down 4%. Yet stocks will be nearly halved and a supply rationing rally is unfolding. Our adjusted balance sheet features Canadian canola stocks/use of 5.8%, vs. 13% in 14/15 and record low stocks/use of 4.2% in 2012.

  • Our 13.7 million mt production estimate is 6.6 million mt above total domestic use – which is projected to be flat in 14/15 – and this surplus will be declining for a second consecutive year. The market will have to slow exports, and still drawdown ending stocks to a three-year year low. We peg Canadian canola ending stocks at 875,000 mt, down 750,000 from the USDA’s 15/16 forecast and down 1.2 million mt from a year ago. Assuming steady crush and feed disappearance, Canadian canola exports will be capped at 7.9-8.0 million mt, down 1.3 million mt from the peak of 2013. Note also that world canola stocks will be in decline amid the loss of Canadian and EU supply, with global 2015/16 canola stocks/use estimated at 6.2%, vs. 10% in 2013, the lowest total since 2003. The canola balance sheet is an island of supportive vegoil support.

  • The market is already sending the signal for end users to seek alternative vegoil supplies. The graphic below charts US soybeans and Canadian canola prices in US$/mt, and the canola market has develop a premium to soybeans rather quickly. This is far different from what’s been witnessed in the last two years. Spot canola is priced at a $52/mt premium to soybeans, and an even steeper $61/mt for autumn delivery. There’s no shortage of North American or global oilseeds/products, but how it gets distributed will affect inter-commodity spreads. We expect sub-$9.00 soybean futures to weigh on canola, but hefty premiums will be paid for canola over the course of the 2015 marketing year. Stats Can will update Canola acreage on 30 June with initial production due in mid-August.

6 June 2015

Weekly CCI Analysis:

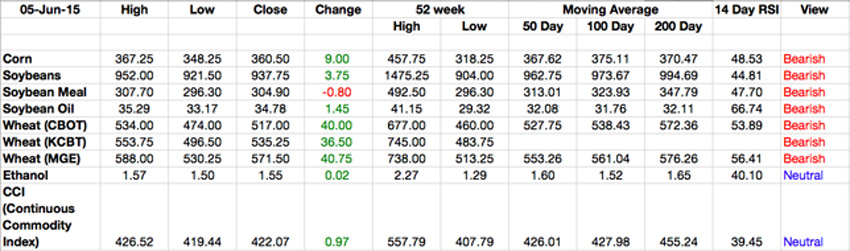
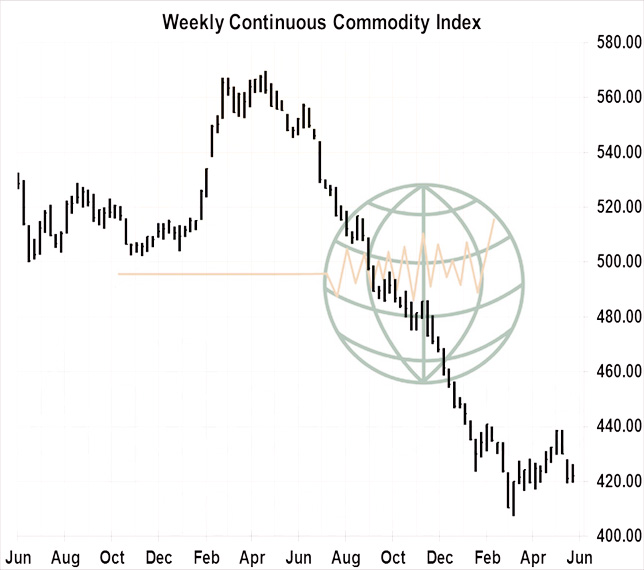
A sharp rally in the value of the US$ and weak economic data from China continues to weigh on world raw material values. The weekly CCI/CRB index finished little changed on the week amid a late week rally in crude oil bringing the CCI index to a slightly positive close. However, as the chart below reflects, the CCI is in a technical position of needing to rise above the late May highs for a new bullish trend to emerge. We expect that the Fed will raise US interest rates starting in September. This will help to spur further gains in the US$. Greece’s deferral on payment until June 30th only delays and potentially worsens their financial plight. Seems they have just “kicked the tin along the road” one more time! Our bullish view of the US$ is likely to keep pressure on commodity prices well into late 2015.
Longer-term soybean analysis:

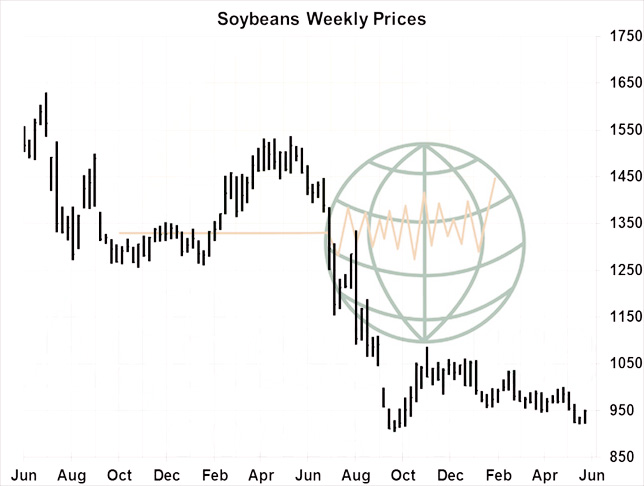
Soybean futures ended the week higher in both old and new crop contracts on short covering ahead of the June WASDE report. Cash prices also improved slightly through the week, but are more than $5 cheaper than a year ago with June 1st stocks estimated at multi-year highs. NASS will release its initial soybean crop conditions on Monday and good/excellent ratings are expected to be above 70%. Early growing conditions are favourable and the forecast offered into late June looks good. Trend or better yields look reasonable at this time, with many in the trade looking at yield potential of 46- 48 bu/acre. This along with expectations of larger US soy seeding in the June acreage report will produce a sizeable increase in the 2015 carryout. Our 2015/16 US end stock estimate is above 600 million bu. Our initial downside price target rests at $8.40-8.60 midsummer with the potential of sub $8 at harvest. Sell rallies above $9.30 November in coming weeks as $1.30-1.50 of weather risk does not seem needed or indeed justified at this time.
Longer-term corn analysis:

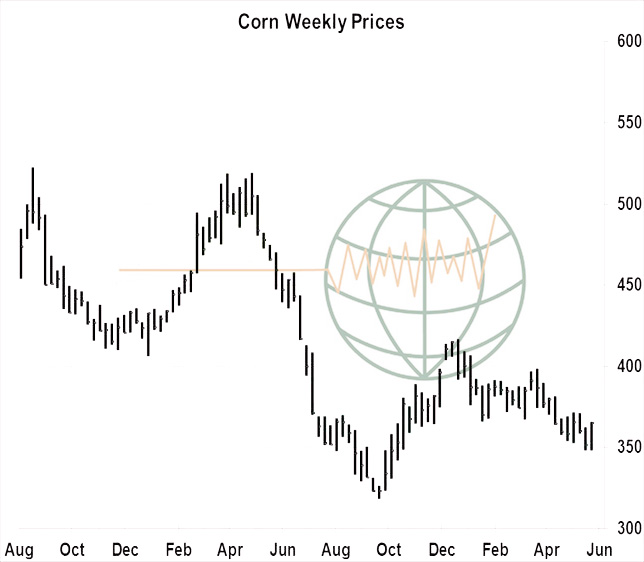
Corn futures bounced from contract lows and settled 9-10 cents higher. Slow planting is noted across parts of the SW Midwest, while short term weather concerns are cited in Western Europe. The longer term outlook, however, remains bearish. Lofty Gulf fob premiums are noticeably curtailing new crop US exports, and NOAA’s extended weather models now peak into the opening days of July, and normal precipitation and normal temperatures will be a feature over the next four weeks. China continues to have issues with its bulging feedgrain inventories. US corn is the world’s cheapest through the next 30 days, but South American fob offers plunge in July and beyond – and US new crop sales are down 24% from last year. A seasonal slowdown in ethanol production is expected beyond late June, and vegetation health maps indicate conditions much better than last year across the C Plains, Southeast, IA, MN, WI and IL. Summer rallies occur every year, but we expect this year’s bounce to be capped at $3.70, spot, and $3.90, Dec. Reward any short covering rally with sales.
Longer-term wheat analysis:

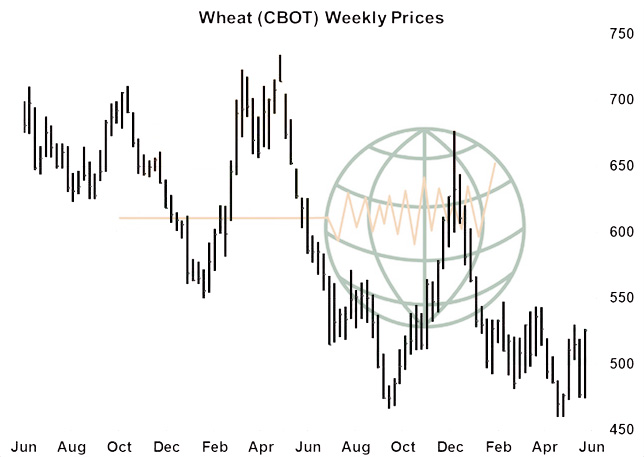
Wheat futures ended higher this week with Chicago contracts gaining 35-40 cents. The US$ spent much of the week lower, while short term dryness concerns linger in Canada and Western Europe. The funds have been swinging wildly between adding and covering short positions in Chicago. Extended forecasts maintain rain chances in Western Canada and Western Europe next week, along with favorably dry weather across the S Plains. If this forecast verifies, an intermediate high is being formed in US wheat. Our wheat outlook is little changed as bearish fundamentals remain intact. We’re unwilling to alter EU/Black Sea production estimates just yet, and uncompetitive fob offers (and another year lacking Brazilian and Chinese demand) is being felt in new crop US export sales. Our work suggests that the US$ remains longer term bullish as US job growth points toward a Fed rate hike sometime in late 2015. Critical N Hemisphere weather lies ahead, and so expect choppy trading into late June, but harvest progress and a surge in US end stocks will cap rallies at $5.40- 5.50, basis spot CME. Black Sea origin for Jul/Aug delivery is offered at prices equal to $4.60.
4 June 2015

  • We have seen another day of rallying prices as the US$ traded mostly weaker and funds have been actively covering short positions.There has been some optimism over Greece’s ability to stump up €310 million for the IMF tomorrow (Friday), but that pales into insignificance when compared with the €1.3 billion which falls due in the coming weeks. It is interesting to note that energies (crude, gasoline and ethanol) were al trading lower around midday.
  • The USDA has today released its weekly export figures as detailed below:

Wheat: 343,700 mt, which is above estimates of minus 75,000-plus 100,000 mt.
Corn: 410,100 mt, which is below estimates of 550,000-750,000 mt.
Soybeans: 477,300 mt, which is above estimates of 150,000-350,000 mt.
Soybean Meal: 50,900 mt, which is below estimates of 75,000-150,000 mt.
Soybean Oil: 32,700 mt which is above estimates of zero-12,000 mt.
  • The above requires little commentary other than to note that US corn sales have been declining in recent weeks as the US’s window of competition gets narrower. Net cancellations were recorded in new crop corn and soybean sales were at the higher end of expectations and wheat sales were a shade below the run rate required to hit the USDA’s last target figure. All in all an unexciting set of figures.
  • Brussels has issued an increased weekly volume of wheat export certificates with this week’s total reaching 502,147 mt, which brings the season total to 31,558,288 mt. The season to date total is now 3.263 million mt (11.53%) ahead of last year. At the same time we saw Brussels give 325,000 mt of Ukraine imports bringing the season to 778,000 mt out of a quota of 950,000 mt. What one hand gives, the other takes away springs to mind!
  • Weather forecast highlights include better rainfall in Canada and Europe beyond mid-June and the outlook has a distinct lack of threatening heat for the US as well as regular rains across the C Plains, Midwest and Delta into the third week of June.
  • In other news we have seen the Rouble fall around 3% today on renewed troubles in E Ukraine, a subject that has been on the back burner for some while now. Doubtless the lower crude oil prices and potential for an extension of EU sanctions has not helped the Rouble’s cause either! The potential issue going forward is the possibility of a “trigger” in the Russian export tax; today’s prices will not attract anything more than the minimum $1, but as we have seen a move in excess of 10% in the value of the Rouble it will not take much to change the picture significantly.

3 June 2015

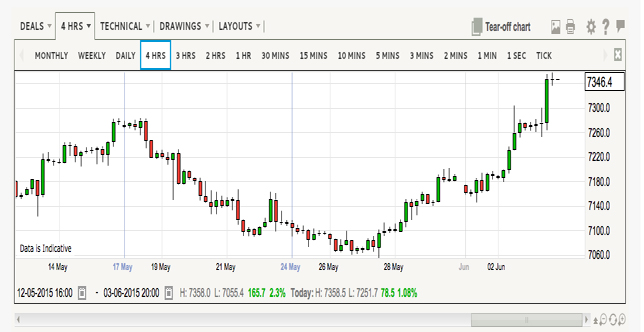
  • The ECB has indicated it is on hold despite uneasiness over the Greek situation and looming credit payment deadlines on Friday. It has suggested that QE is producing the desired results and the market responded in bullish fashion. As can be seen from the above chart the €uro has appreciated over 4% since the low set in late May. European stocks and equities rallied, and this has spilled over into raw materials and commodities, which has in turn prompted additional short covering as far afield as Chicago.
  • Additionally there is a slight raising of concerns over dryness in parts of Europe and increasing temperatures in the forecast is triggering some nervousness over wheat crops in particular. Much of the EU wheat crop is now in the grain filling stage but finishing rains are still desirable. Corn crops within the EU are more vulnerable and there is little doubt that rains will be required in coming weeks. It is somewhat comforting to note that European droughts are difficult to maintain with drought conditions only really impacting about every 20 years, half the frequency of the US. Regardless of today’s market reaction the 8-15 day weather forecasts include significant precipitation across the driest regions.
  • Dryness in W Canada is also being watched closely by the global wheat trade. Seeding is not currently an issue but the arid profile of W Canadian weather is in stark contrast to recent years.
  • On a less pessimistic note, US corn and S American soybean selling has been noted on the current rally as anticipated and this appears to be limiting gains. Record large US old crop corn stocks offer plentiful supplies and shortages are not a market moving issue.
  • Later trade saw early gains given back as news of Chinese soybean meal defaults were reported, which impacted not only soybeans and products but also the grains which closed on (or near) the session lows.
  • Informa Economics today reduced its forecast for US 2015 winter wheat to 1.481 billion bu from 1.486 billion previously. Their all wheat projection stands at 2.143 billion bu vs.the USDA’s latest figure of 2.087 billion, of which the winter wheat crop is 1.472 billion. The USDA’s figures are due for update on 10 June in their next release.
  • Argentine corn output for 2014/15 was projected 1 million mt higher than a month ago at 25 million mt, whilst soybean output was also increased by 1 million mt month on month to 60 million mt. The Brazilian soybean crop for 2014/15 was estimated 1 million mt higher month on month at 95.5 million mt. By way of comparison FC Stone left their soybean estimate for Brazil unchanged at 94 million mt whilst increasing their estimate for the corn crop by 2.15 million mt to 80.19 million mt.

3 June 2015

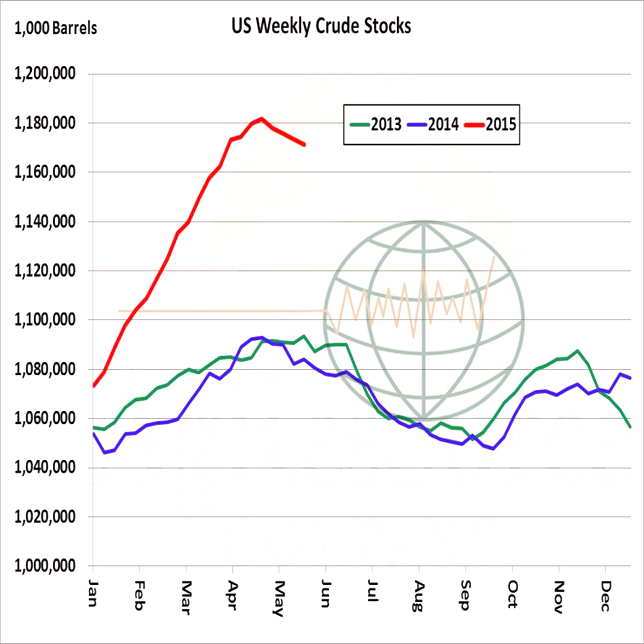
  • US weekly crude oil stocks have started a seasonal decline, but from a historically high level. The chart below highlights the problem facing OPEC members at this Friday’s meeting: the world is awash in energy and producers are still trying to maintain their market share. We look for OPEC to hold its production level at a record high and that WTI crude futures struggle against $62-65.00. Also, we sees no reason why the €uro should continue its rally (up 2% Tuesday) and that by late summer or early autumn, the €uro will fall to be priced at parity with the greenback.

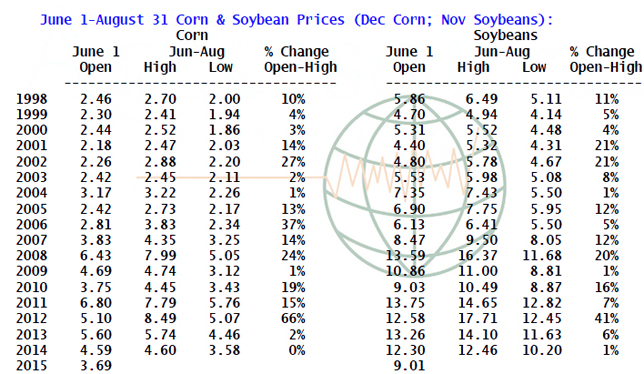
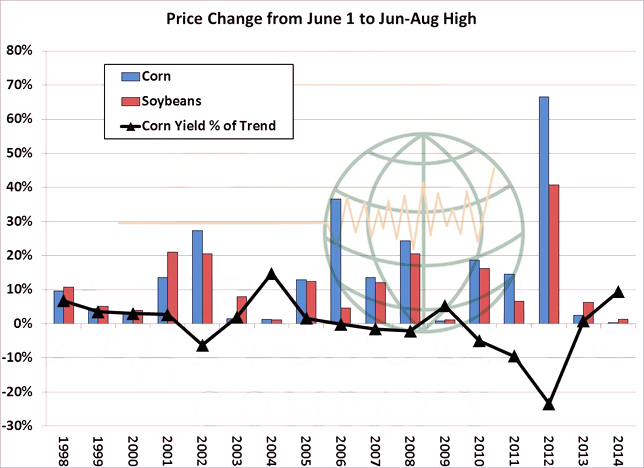
  • The table above lists corn and soybean settlements on June 1st and high and low prices during the Jun-August period. Rallies occur every summer, but the question is: just what kind of advance can be expected, and at what point should summer rallies be rewarded? We view this as a function of weather, and namely potential US corn/soy yields. This is displayed in the graphic below, which charts the % change in prices from June 1 to seasonal highs in June-August and compares them to corn yield’s performance against trend. The most substantial summer rallies have occurred during years that corn yields falls sharply below trend. Otherwise, in years in which yield has met or exceeded trend, the average rally in corn from June 1 to the Jun-Aug highs is 8% – which in 2015 equals just $.30/bu. The average rally in soybeans rests at 7%, which in 2015 is equal to $.60/bu – $.16 of which was scored Tuesday!

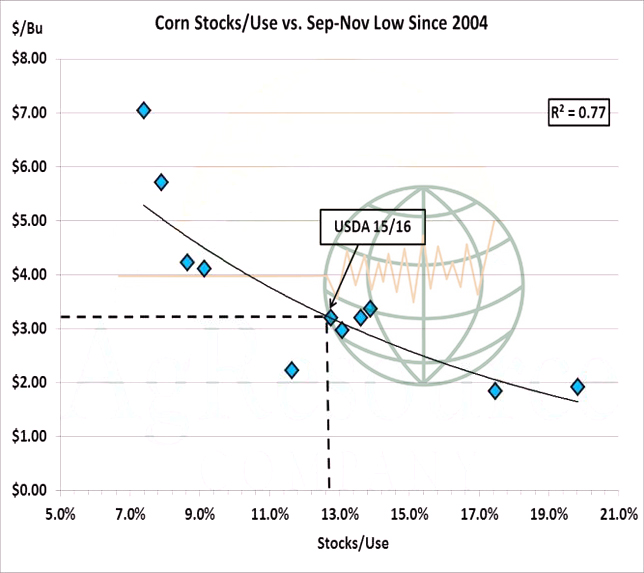
  • We should also be mindful that in years when yield is above trend (2004, 2009 and 2014) summer rallies in corn and soybeans managed meager 1% gains from their June 1 settlements. With two-week and longer term climate forecasts indicating normal precip and temps across the US Ag Belt, it’s important for growers to reward even modest CBOT rallies with sales. Any test of $3.95 Dec corn and $9.40 Nov beans are targeted unless a quick and rather dramatic weather pattern shift emerges. Heavy new and catch-up sales will be advised by many on such a normal price recovery. The  graphic below displays corn stocks/use vs. autumn lows, and assumes the USDA’s estimates in the May WASDE – which are a bit optimistic with respect to new crop consumption. This model suggests lows will be posted at $3.00-3.20, and indeed there’s a strong correlation that price corrects from summer highs with lows in August or at harvest. Finally, a 2% recovery was posted Tuesday in corn/soy futures which has met the minimum amount required in above trend yield years. Our bet is that December corn struggles above $3.85 and November soybeans above $9.25.

2 June 2015

  • The US$ fell sharply vs.the €uro this morning as consumer prices were reported to have risen 0.3% indicating that QE is working across the Eurozone to stabilise the currency. Additionally, Greece offered a financial package which it hopes will break the logjam and secure a deal that will avoid an IMF default. This news along with some short covering in advance of Friday’s US jobs report placed the greenback under pressure, which also sparked something of a rally in commodities.
  • Soybeans were reported to be 71% planted, which was below the 75% level that was anticipated, and compares with 61% last week and the ten-year average of 74%. Corn plantings came in at 95% (1% behind expectation and behind last year’s 94%), whilst the proportion rated good/excellent was 74%, unchanged week on week and a touch behind last year’s 76% but ahead of the ten-year average of 70%. Winter wheat rated good/excellent slipped 1% week on week to 44%, which compares with 30% last year and the ten-year average of 43%.
  • From a general perspective, China remains a slow buyer of S American soybeans as their cash soybean meal market shows little, if any, signs of price uplift. Chinese meal markets appear to be languishing at a seven year price low and record soybean import volumes are likely to add further downward price pressure as stocks build in coming weeks.
  • Central US weather forecasts offer 0.5” to 1.75” of rain for the N Plains and NW Midwest this week with much needed dry conditions across the S Plains and the rest of the Midwest. As conditions warm up they will encourage crop growth, in summary the US weather is favourable.
  • As we move towards the end of the day it feels very much as if we have seen a “currency” dominated session as the US$ has slid to sharp losses vs. Not only the €uro, but also other currencies and funds have been in evidence covering short positions prompting commodity price gains. The large net short positions (as we have so often mentioned) in corn, wheat and soybeans has once again proved an “Achilles Heel” to the continuance of the longer term price downtrend. Some US$ slippage has been attributed to speculation that Greece could receive a financial “band-aid” from the ECB to avoid default. There is no indication as to whether, or not, Greece’s offer will find acceptance and we will doubtless continue to see volatile currencies heading into the remainder of the week and this will also have an impact upon commodities.
  • Yesterday’s market action in Chicago suggested that funds added over 8,600 short soybean meal contracts on the downside breakout and over 9,600 long soybean oil contracts as that market surged higher. The big increase in position size was probably a good pointer to some sort of turnaround today, which has indeed been the case
  • All in all, have we witnessed the seasonal market bottoms? Our inclination remains that the answer is, “Not yet.” Large fund shorts have left us vulnerable to spikes, as we have frequently suggested, and we do not yet see a fundamental shift in the “big picture”. Regrettably, it will likely take a while for the market to give back the recent gains but we still look for downside in what will undoubtedly remain choppy and volatile trade.