25 August 2015

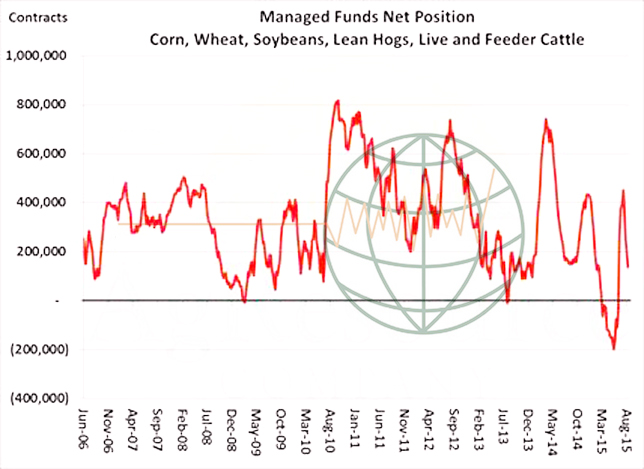
  • Despite the recent liquidation, funds are still holding a net long position in US ag futures markets which is illustrated in the chart below. This is one reason why ag commodities are so closely following the developments in US and world equity markets as they (funds) push to shed any market exposure until the emerging market meltdown bottoms. It is our expectation that some sort of trading bottom should be formed in ag markets by mid-week. However, there will likely be a retest of that bottom by late September. Our view remains that commodities will not forge their final bottom until the 4th quarter 2015.

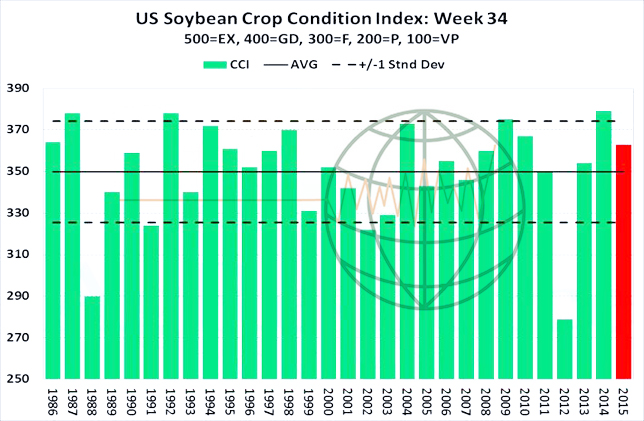
  • Soybean futures fell to sharp losses at the start of the week on liquidation triggered by steep losses in global equity markets. Funds were estimated as net sellers through the day of 15,000 contracts in soybeans, 6,000 contracts in soybean oil, and buyers of 3,000 contracts in the soymeal market. The USDA’s daily export reporting system showed soybean sales of 120,000 mt made to an unknown destination, but total new crop sales remain well behind last year. S American basis has turned higher in recent weeks, but it will be quite difficult for the US to catch up on lost business. Crop ratings were unchanged for the 4th consecutive week with good/excellent holding at 63%. The chart below shows the 2015 crop as being rated well above average for late August. Harvest progress was reported at 15% in LA, just ahead of the 5 year average of 11%. Soybean futures this week are now deeply oversold and traded to our initial downside target, though our view of the market remains bearish. Large global supplies and the lack of demand growth look to cap rallies in the year ahead and the market looks to be targeting the 2008 low, under $8.

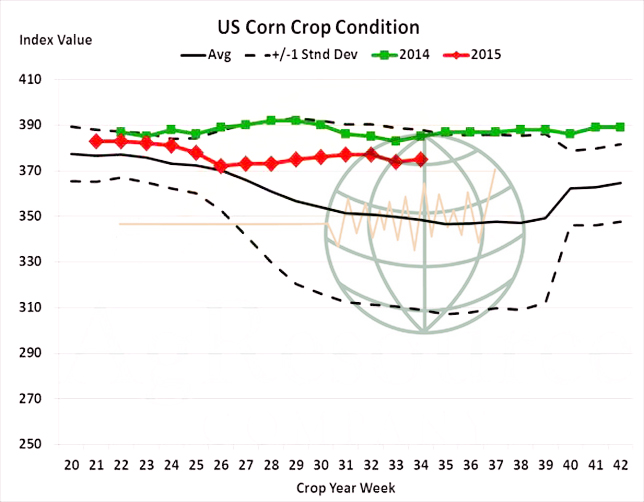
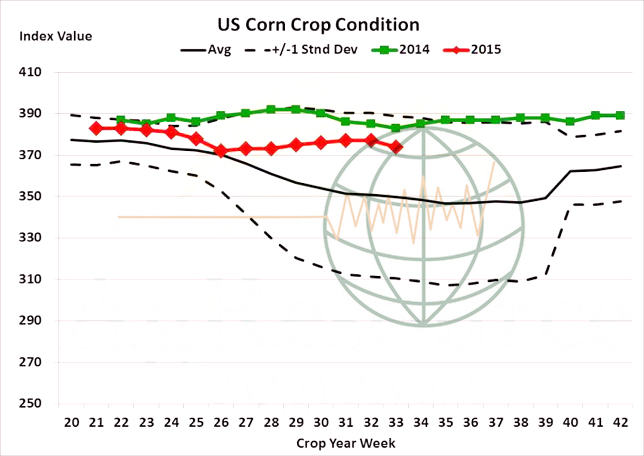
  • Corn rallied 4-5 cents amid corn-bean spreading and a sharply lower US$. Crop conditions this week were unchanged at 69% good/excellent, with a 1 point improvement noted in the crop condition index amid a shuffling of the good and excellent categories (good was down 1; excellent was up 1; the excellent category has more weight in the index value). A more neutral pattern is likely into NASS’s September crop report, and as China’s absence from the US market has more of an impact on soybeans than grain markets. However, focus has to remain on demand, with Argentina still the world’s low cost supplier and with Brazilian export commitments having surged 2 million mt in just the last week. Crop condition models maintains a range of 166-170 bushels/acre relative to national yield in the September report, and China now requires importers to report who the final end user of bought supplies will be, which is just another hurdle to large scale foreign imports. Harvest progress is 87% complete in LA, 47% complete in TX and 31% in AR. We continue to favour a policy of selling into short covering rallies.

  • Wheat futures ended 3-6 cents higher, as a plunging US$ offset steep losses in energy and equity markets. There’s little new fundamental news to report, with Black Sea cash prices a bit weaker and with rainfall to linger across Eastern Australia over the next 2-3 days. But contrary to corn and soybeans, funds as of last week were short and a modest short covering effort was noted yesterday. Russian wheat is buyable for spot delivery at $181/mt, which is comparable to $4.50 basis September Chicago. French wheat for Sep/Oct is quoted at $190-195, with US Gulf SRW at $204 and HRW at $218. The Russian ruble today hit a new all-time low, which has pushed domestic prices in US$ terms down to $3.25-4.00. Russian wheat priced in rubles has been rallying, but not to the degree that export controls are needed. Currencies will keep non-US wheat competitively priced into early winter. US weekly export shipments through last Thursday totaled 10.2 million bu, roughly half of the previous week’s total and well below the average pace needed to hit the USDA’s forecast. We calculate that some 16-17 million bu per week are needed, so far, this level has been achieved just three times. More weekly sales and shipment data is needed, but the USDA’s forecast appears overstated without a Northern Hemisphere crop threat this autumn/winter – and note that widespread rainfall is offered to Europe and Central Russia in the first week of September. Short covering rallies will likely be a periodic feature of the market. We continue to believe that fundamental advances will struggle above $5.30, basis December futures, and rallies above this are opportunities!

24 August 2015

  • Today has seen “meltdown: in Asian stock markets, which has spread with contagion around the globe. The Dow opened 1,000 points lower although the “black box” trades seem to have had enough by midday and something of a recovery followed with the Dow (only!) 250 lower at midday. Some support may well translate into Asian markets tomorrow but we are not holding our breath. Commodities followed with prices sharply lower in early trade but recoveries were also clear with Chicago markets almost back to Friday’s closing levels with under an hour to go.
  • The drop in global equity markets is based upon fears over slowing market growth in emerging markets. However, unlike in 2008, there is not a systemic risk to US or other developed nation’s banking systems based upon depreciating assets (house prices) but in the absence of global economic growth there is a real risk to future commodity demand (and growth). This is the underlying concern that markets are considering, and will likely plague any market rallies, particularly in the short term.
  • The US$ has fallen in value against the €uro (or has the €uro gained?) and this added some support to Chicago grains, wheat in particular, with corn following behind. With all that we have seen in the last week or so, and particularly today, it feels extremely difficult for major rallies to succeed particularly with the US harvest staring at us in a few short weeks.
  • The EU crop monitoring unit, MARS, has increased EU soft wheat yield marginally to 5.81 mt/ha compared with last month, this is above the five year average (by 2.5%) but still below last year. Corn yields were forecast lower at 6.4 mt/ha down from 6.71 mt/ha last month and below both last year’s figure and the five year average.
  • US crop conditions, which will be reported later tonight, are expected to see an unchanged to slightly better figure based upon last week’s favourable weather conditions. We will update on this tomorrow.

20 August 2015

  • The USDA has today released its weekly export figures as detailed below:

Wheat: 314,400 mt, which is within estimates of 300,000-500,000 mt. (Old crop 314,400 mt – New crop nil)
Corn: 859,100 mt, which is above estimates of 350,000-800,000 mt. (Old crop 282,700 mt – New crop 576,400 mt)
Soybeans: 830,800 mt, which is within estimates of 500,000-1,050,000 mt. (Old crop 46,400 mt – New crop 784,400 mt)
Soybean Meal: 232,800 mt, which is above estimates of 25,000-225,000 mt. (Old crop 62,800 mt New crop 170,000 mt)
Soybean Oil: 7,100 mt, which is within estimates of zero-15,000 mt. (Old crop 7,100 mt New crop nil)

  • New crop corn and soybean sales were pretty good, but the export data was otherwise uneventful. Cumulative new crop corn sales are 40% behind last year, new crop soybean commitments are 46% down, wheat is 15% down and soybean meal commitments are 50% behind last year. Significantly improved export demand is essential, and soon, if USDA forecasts are to be reached.
  • Brussels has issued weekly wheat export certificates amounting to  591,624 mt, which brings the season total to 3,079,879 mt. The season to date total is 388,932 mt (14.45%) ahead of last year.
  • A couple of general comments:
  • In soybeans the Pro Farmer crop tour is still confirming reasonably high yield potential, and as a consequence it could be that we have still not seen the market lows yet.
  • In corn we seem to have a situation where yield concerns are limiting selling and demand concerns are limiting buying! Where can a market like this go?
  • In wheat there is still no definite sign of a low but the oversold market condition and slight reversal may provide some support and additional buying.
  • The market is seeing some spread trading of grains against the soybean complex due to the persistence of favourable Central US weather. The industry well understands that this week’s rain and now the upcoming cool temperatures are ideal for yield potential, but its soybeans that will benefit more as this crop is still in its reproductive stage, whilst corn is increasingly pushing closer to full maturity.
  • The Pro Farmer tour is pushing out state by state data on corn that suggests NASS is too high in its corn yield estimates. The Tour numbers are coming in well below the August NASS figures, which is not in itself unusual, however the deviation is greater than would be normally expected – maybe a warning sign! To counter this, we would again suggest that global export demand for both grains and oilseeds remains slow and this point should not be overlooked. World wheat and corn trade for August is some 20% behind last year, and China appears very slow in stepping forward and buying new crop US soybeans in the second half of October and November. Worryingly (for the US) it is reported that an estimated 6 million mt of S American soybeans have been sold to China in the September to November shipment period, the latter part of which is the key “gut slot” for the US soybean export programme. Replacing these “lost” sales will prove difficult for the US – if not impossible – and the impact upon end stocks should be borne in mind.

18 August 2015

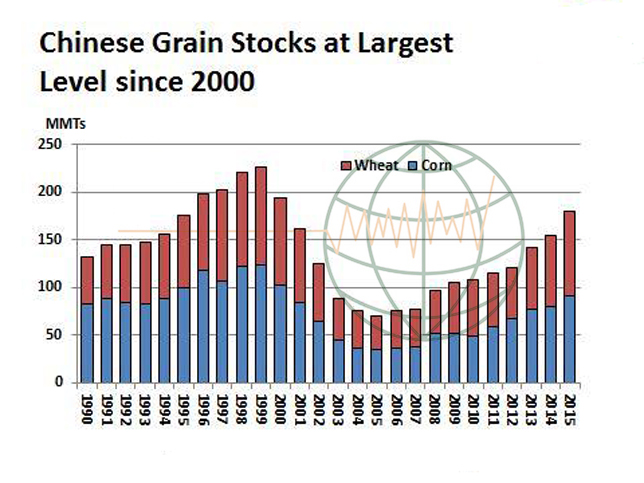
  • China is swimming in grain! The chart below reflects Chinese grain stocks since 1990 – and today’s estimated levels are at their largest levels since 2000. Most Chinese grain users suggest that these grain stocks are being undercounted by USDA. China has guaranteed its farmers $9.70/bu corn in recent years which has spurred production and imports of other non GMO grain. The sheer supply of Chinese corn/wheat stocks has the Government planning for a policy change that could slow/end grain imports of nearly 20 million mt annually. Chinese ag policy needs to be closely watched as another record harvest approaches.

  • After the close, NASS reported that national soybean crop ratings were unchanged through the week with good/excellent holding at 63%. Crop ratings declined in 7 states, increased in 9, and were unchanged in 2 states. The absence of a decrease in ratings is adding confidence to USDA estimates. We hold to a bearish outlook with resistance in November ’15 futures expected above $9.30, while our initial downside target rests at $8.50-8.60 by harvest.

  • Corn crop conditions fell 1 point to 69% good/excellent vs. 74% a year ago, following last week’s warmth and near complete dryness. Conditions also tend to seasonally erode beginning in late July/early August. However, steady to higher ratings are expected next week amid this week’s cool frontal pass, with the latest models still offering widespread totals of .50-3.00” to all but the far E Corn Belt into Friday/Saturday. As for acreage, assuming some 1-2 million acres are added to the FSA data series – which has been the case in recent years – we can find no reason that NASS will adjust their estimate until the final report in January. The goal of the market is now to find higher domestic and export consumption rates, which suggests a slow but steady bearish trend into harvest. We continue to remain willing sellers of 15-20 cent rallies.

  • Spring wheat conditions are 70% good/excellent, above estimates of 69%, up from 69% week on week and up from 68% year on year, and the crop is now 53% harvested vs. 15% a year ago, and the winter wheat harvest is complete. Combines are actively rolling across the Northern Hemisphere and consumptive interest remains lacking. We would anticipate another Egyptian tender early this week on any additional price break. The Australian weather forecast maintains widespread shower activity across New South Wales on the weekend, with totals pegged as high as .75- 1.00”. El Niño continues to strengthen, and will likely continue to do so into the autumn months, but this so far has had little effect on the Aussie climate. US wheat futures are left following world cash prices, and to some extent US corn futures. There’s simply no shortage of food or feedgrain, and without a shift to lasting heat and dryness in Australia in late August and September, a range of $4.80-5.20 will be sustained through the months ahead.
  • With less than an hour to go in Chicago soybeans and wheat are trading lower with corn just in positive territory. Widespread rains in the last 24 hours and a favourable forecast into next week appears to be showing the greatest benefit to the bean crop, hence price downside. The overnight drop in the Chinese stock market (some 6%) may also be contributing to weakness in the soybean complex. Many will question the correlation between Chinese equities and Chicago soybeans, and the link is somewhat convoluted, however the market is clearly uncomfortable with economic contraction in the world’s largest end user of soybeans and products – simple as that!

17 August 2015

  • This morning, the FSA division of the USDA published their first round of monthly data featuring a snapshot of what registered certified acreage and prevent plant are at so far this season. The data is not considered viable until October when NASS (the statistical division of the USDA in charge of estimating planted acreage) will use the data to support their estimates. Typically, this leads to a change in planted acreage in the October Crop Production report. There are always a few key things to keep in mind while analysing this report: not all acres are certified/registered, there is no indication of farmer reporting pace compared to previous years, there is no indication of FSA database entry rates compared with previous years, and even small things such as staff size at certain offices can have an impact on the numbers, there is not a fixed acreage spread from NASS to FSA, and the month to month change in the FSA data is not consistent.
  • Consequently, we have to bear in mind that:
    • The data is neutral to bearish, we will call it neutral because the of the preliminary nature of the data, and the lack of a consistent tracking between FSA and NASS.
    • August acreage numbers are similar to last year. From this data alone, NASS corn acres could be too low. NASS soybean acres are correct.
    • Prevent plant acreage (which does not normally change much from Aug to Final) is elevated from last year at 5.2 million acres. 5.2 million is on the lower side of expectations. Some are estimating 2015 PP at 6.3 million.

  • The Pro Farmer Midwest Crop Tour’s initial corn and soybean yield potential,on day one of their annual tour, suggests that yields are showing potential for an above average figure. Today’s data is based upon west-central Ohio, which is trending above average whilst crops further north were showing the effect of excess rains in spring. The final results of the tour will be published on Friday, and whilst interim data is of interest, it is really the final figure we are looking for.
  • NOPA (The National Oilseed Processors Association) today released data showing its members crushed a record 145.22 million bu of soybeans during July, about 3-4 million bu above trade expectations. US soybean oil stocks rose to 1,624 million pounds with meal exports pegged at 590,582 mt. The crush data was seen as supportive, but the CBOT rally was short lived as favourable Central US weather continues to raise US soybean yield expectations.
  • Black Sea wheat prices continue to decline to new lows as tepid demand and rising Russian wheat crop estimates continue to offer pressure. We have heard that Russian 12.5% wheat is offered as cheap as $181/mt with bids at $177.00. The lack of demand for Russian wheat is pushing traders to become more aggressive with offers as they think ahead to the cold of autumn, which is not that far away!
  • Midday US weather forecasts look favourable with a mix of rains and cool temperatures into the end of the month. Chicago markets are heading into the close on a lower note tonight.

15 August 2015

  • The ongoing decline in crude and gasoline is expected to weigh on ethanol production and blending longer term. ARC has no major disagreement with the USDA’s new crop 5,275 Mil Bu corn used for ethanol forecast, but the issue ahead surrounds discretionary blending. New crop ethanol production margins are calculated at just $.15/Gal, and futures-based blend margins are slightly negative. The incentive to produce above government mandates is lacking, and ethanol prices are expected to drop further over time.

  • Selling returned to the soy complex on Friday and beans and meal ended lower. Market news at the end of the week was limited, but the November soybean contract registered the largest one-week loss in more than a year. Next week will bring another flood of fresh fundamental data for the market. On Monday, July crush data will be reported by NOPA while the USDA’s FSA office is scheduled to report certified acres as of August. The crush report is expected to show a large July processing total, but at this point in the year will have little (if any) impact on prices. The certified acreage data in recent years has received a lot of attention on release days, but has not proven to be a reliable indicator of any changes in acres. Additionally, a number of private crop tours will be underway, most notably the Pro Farmer Crop tour, with yield estimates to be released at the end of the week. The USDA yields this week was one of the largest surprises on record, so the trade will look to the Pro Farmer estimates for confirmation. Our view is that rallies will continue to struggle under excess US and global supplies. Initial price resistance is expected above $9.30 basis November ’15 futures and our initial downside target rests at $8.50-8.60 by harvest. Any short covering rallies should be viewed as selling opportunities at this time.
  • Corn futures settled unchanged on Friday, and ended the week down 8 cents. Corn-soybean spreading was noted amid heavier rain forecast for the vast majority of the Central US. This will affect soybean yield more, but this too will be favourable for late developing corn. Additional long liquidation is possible next week if the current US forecast materialises – latest forecasts project rainfall of .50-3.00” across the whole of the Corn Belt next from mid to late next week. Near normal temperatures are scheduled for the last half of August. Crop condition reports on Monday are expected to be steady to down 1% following this week’s dryness across the C and E Corn Belt, as conditions historically decline in late summer. A counter-seasonal boost is possible if next week’s forecast rain actually falls. Pro Farmer’s crop tour kicks off Monday and conditions in the Eastern Corn Belt, specifically, will be widely followed. With NASS’s August crop report now digested, the goal of the market is to boost domestic and export consumption in an era of weak Chinese growth, eroding ethanol production and blend margins and steep competition from other major exporters. Supply driven rallies (based on FSA acreage data or upcoming Crop reports) will provide selling opportunities. Severely adverse S American weather this winter is needed for lasting bull run.
  • US futures ended steady to 5 cents higher on Friday and settled down 5-8 cents on the week. There’s little fresh news available, but the session was marked by funds buying grains and selling soybeans amid ongoing improvement in next week’s Central US weather forecast. We continue to believe that rallies in the weeks ahead will be short-lived – Gulf SRW basis rallied sharply this week, which along with support in the futures market has further widened the US’s premium to other origins. Russian domestic prices in US$ terms, as evidenced in the graphic below, have fallen to seasonal lows and range from $3.75-4.20/bu. Australian weather will increase in importance beginning in late August, and following recent rainfall a drier than normal trend is offered to Southern and Eastern production areas in the next ten days. But there’s been no end to declining Black Sea cash markets of late, and some are now pegging the Aussie crop at 24 million mt, unchanged from ABARES’ first estimate in spring. New fund long positions hinge upon an Australian drought in September. Fundamental resistance is pegged at $5.20 basis December ’15 Chicago futures.