13 August 2015

  • Hot on the heels of yesterday’s price rout in Chicago we saw Egypt’s GASC slip in a crafty wheat tender for 21-30 September shipment! Of note was the 13% maximum moisture limit that would, once again, potentially present issues for EU (read French) exporters. They picked up 175,000 mt at an average price of $194.74/mt (basis C&F) with 115,000 mt from Ukraine and 60,000 mt from Russia. The price paid was some $4/mt below that paid earlier in the month when they broke the $200 barrier for the first time in ages, in a tender that attracted more than 1.4 million mt of offers. Today’s business, once again, reflects the desire of traders to secure sales as the FOB levels reflect a discount of between $5-10/mt below quoted replacement levels.
  • Today has seen a degree of consolidation in the market following yesterday’s plunge in prices, which followed the release of the latest USDA figures. Short-term direction will be driven largely by the volume of rainfall across Central US growing regions.
  • The USDA has today released its weekly export figures as detailed below:

Wheat: 422,200 mt, which is within estimates of 400,000-600,000 mt.
Corn: 531.100 mt, which is within estimates of 350,000-750,000 mt.
Soybeans: 756,800 mt, which is within estimates of 300,000-1,000,000 mt.
Soybean Meal: 334,100 mt, which is above estimates of 25,000-175,000 mt.
Soybean Oil: minus 800 mt, which is below estimates of 5,000-20,000 mt.

  • The figures could hardly be described as exciting, wheat figures reached around half of the prior week’s level, new crop corn at 20 million bu was the best of the season to date and new crop soybeans at 26 million bu were down 14 million bu from a week ago and compare with 43 million bu at the same time last year. This may be considered a depressing set of figures from a US exporter’s perspective!
  • Brussels has issued weekly wheat export certificates amounting to  390,395 mt, which brings the season total to 2,488,255 mt. The season to date total is 524,278 mt (26.69%) ahead of last year.
  • Stratégie Grains has updated EU 2015 soft wheat output to 144 million mt, a 3.1 million mt increase month on month although it is around 4% down year on year.. Barley was forecast 1 million mt higher at 58.8 million mt, which is down 3% year on year whilst corn at 59.6 million mt was 7.1 million mt down month on month and 21% down on last year’s record 75.7 million mt level.

12 August 2015

  • General comments upon first sight of the report suggest that they are outright bearish, US corn yield at 168.8 is 2 bushels/acre higher than July’s estimate and soybean yield up 0.9 bushels/acre at 46.9 bushels/acre. Our earlier commentary suggesting that excess June rain correlates poorly with yield appears to be holding water (no pun intended). Also,  corn and bean yields across IL, IN, MO, OH and the drier pockets of the Southeast are down 5-20% from a year ago. Yields in the Western Corn Belt are up 2-15%. It should be noted that USDA yield forecasts are now a function of weather and statistical modelling rather than what was previously thought to be a “wet finger in the air”!
  • Soybean harvested acres, following NASS’s resurvey, were lower 0.8 million. Corn harvested acres were left unchanged. Additional fine-tuning of yield and acreage will no doubt occur in subsequent months, but barring a widespread early frost, our takeaway from the August report is that US supply risks have been nearly eliminated.
  • Global 2015/16 corn stocks were boosted 5 million mt to 195 million mt due to higher production and a modest downgrade in domestic feed use. Wheat stocks were raised another 1.7 million mt to 221.5. Global soybean stocks were lowered 5 million mt, as Increased domestic use and trade offset higher production.
  • To download our recap of today’s USDA report please click on the link below:

USDA Recap 12 Aug 15


11 August 2015

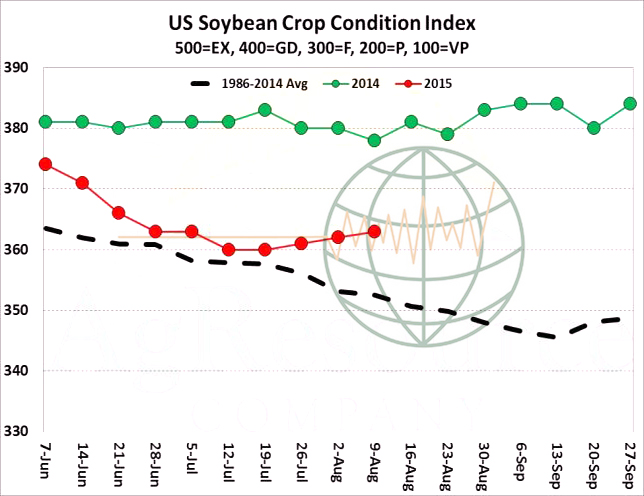
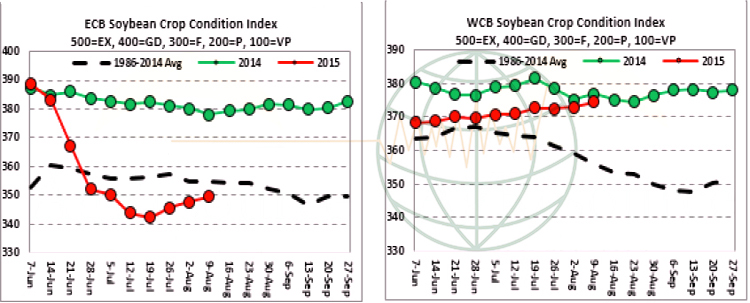
  • National soybean ratings through last week held steady at 63% good/excellent although the index of all ratings advanced slightly as 1% moved from good into excellent. Crop ratings bottomed in early July and have since counter seasonally inched higher on reduced rainfall and sunshine. The mid-summer increase in ratings is improving the odds of trend or above national yield, while a few late summer soakers could push the US yield to 46 bushels/acre or above.

  • However, despite the national figures it is interesting to break out crop ratings by the East and Western Cornbelt. Note  from the graphic below that the WCB continues to creep higher and is nearly unchanged from a year ago, while ratings in the WCB continue to advance. From our view, yield potential is improving at the end of the summer.

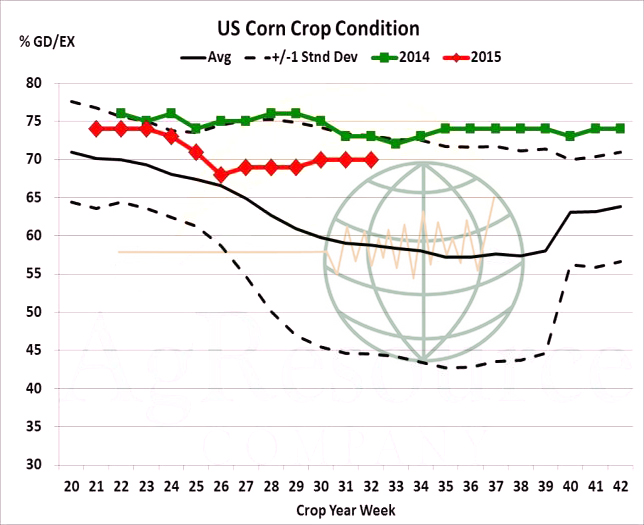
  • US corn good/excellent ratings as of Sunday were unchanged at 70%, down just 3% from a year, and which some work indicates an August yield of 166 bushels/acre. By-state changes of note include improvement in MN (now at 89% good/excellent), SD and NE. Downgrades were recorded in NC, ND, PA and WI. All other major producing states were unchanged. Nationally, 50% of the crop is in the dough stage, vs. 49% on average. The market as a whole expects US yield to be 164.5 bushels/acre, and 2015/16 end stocks to be lowered 150 million bu to 1,450. But also on Wednesday, S American exports should be increased based on the pace of sales to date, which suggests US shipments will (should) be lowered.

  • US spring wheat conditions as of Sunday were pegged at 69% good/excellent, vs. 70% a year ago. Spring harvest has reached 28% complete, vs. 20% on average. NASS’s August report is expected to reveal lower corn and soybean harvest estimates and end stocks. But US wheat production should be raised 10-20 million bu, and recall EU and Black Sea crops should be raised a combined 1-3 million mt. Major exporters supply and stocks/use will be higher on the month. Russian fob prices for delivery into November are priced at levels comparable to $4.70-4.80, basis Chicago futures. Winter wheat is 97% harvested, up from 93% week on week, up from 94% year on year and ahead of the 5 year average of 90%.
  • Today’s markets have lived up to expectation by displaying a classic “Turnaround Tuesday” with soybeans almost 30 cents lower, with corn and wheat shedding 3% in nearby positions. Wheat in both Paris and London and Rapeseed in Paris have (generally speaking) finished the day at levels below Friday’s closing prices displaying a serious disregard for the turmoil in Chicago yesterday.
  • Is the Chinese currency devaluation, with potentially more to come, a factor? Our belief is that it is, as it will likely weigh on US$ denominated commodities and fears of further devaluation are not boosting confidence today. Crude oil is $1.80/barrel lower and gasoline and ethanol futures are trading $0.01-0.02/gallon lower. Last night’s crop ratings (see above) must also have come as a disappointment to the bulls.
  • Tomorrow will be key but as a general comment the market is clearly poised to move – which way though? In soybeans one private forecaster has suggested as much as 2 million acres could have been lost to weather, which is supportive if true. If dry topsoils hit the E Cornbelt in coming weeks this too is supportive as yields could well fall and tighten the supply outlook, which is also supportive. On the other hand, US new crop exports are well behind last season at this time and S America is certainly pressuring US sales and looks likely to do so for some while to come, including the early US new crop period, and this will pressure prices.Technical momentum was seen as potentially (short-term) supportive yesterday, but today’s close could well reduce that support somewhat.
  • In corn, EU November ’15 corn futures translate to $5.24/bu, up from $4.80 on 3 August. It is highly possible that tomorrow will see the USDA adjust the EU crop downwards by as much as 5-6 million mt and the Ukraine crop by 2-3 million mt (due to late season conditions). This is, unsurprisingly, supportive. On the other hand, US pollination weather and lack of heat in the forecast looks as if it could provide big yield potential in the N and W growing region, which would help to offset the heavy July rains in the East, particularly if weather conditions return closer to normal.
  • US wheat stocks are seen higher by the trade tomorrow, and there is an expectation of an upward revision in both Russian and EU output.This, if delivered, will limit upside price moves.
  • Clearly, tomorrow’s report is an important one!

10 August 2015

  • Whilst fresh news may have been thin on the ground today it has been very active in Chicago with markets rebounding to the upside. Soybeans are up as much as 30 cents, corn plus 15 and wheat 12, which means corn is the biggest gainer on a percentage basis. Interestingly, metals and energies are also trading higher. Given there is little, if anything fresh to trigger the move we turn to technical considerations, which have shown reversal patterns, particularly in soybeans and corn at the end of last week, and these seem to have been picked up – and followed – today.
  • Wednesday’s acreage and yield estimates will be the next significant item to be picked over by the trade. Average trade estimates are a touch lower than the FC Stone and Informa figures released last week, and it appears that there is a general impression that downward revisions in new crop end stocks are on the cards.
  • Reuters reported that forecasts for strong soybean meal demand from China and anticipation of a smaller US crop were the key drivers of todays hike in European price levels. S American meal prices rose some $5-10 in Europe and EU origin meal also gained a similar amount. The new forecast estimates that China will import a record 76 million mt of soybeans this year, an 8% increase on the 2014 season. July customs data from China showed July imports to have reached a monthly record of 9.5 million mt, 17.4% up on June. The news countered fears of a Chinese slowdown, which has in recent months fuelled a broad selloff in commodities.
  • Staying in Europe, the French AgMin released its latest estimate of the soft wheat crop at a new record level, 39.3 million mt. The figure represents a month on month increase of 1.4 million mt. However, the corn crop was put at 13.2 million mt, down a staggering 28% year on year. The barley crop was also forecast 0.5 million mt higher at 12.2 million mt whilst rapeseed was seen 100,000 mt lower month on month at 5 million mt.
  • Hot on the heels of the French AgMin was Stratégie Grains who updated their UK crop estimates. The early wheat harvest data showed yields to be slightly above the longer term average and they viewed weather forecasts as conducive to further harvest progress in coming days. Their UK crop estimate was raised 147,000 mt month on month to 15.295 million mt, the third largest in 11 years. Barley output was also seen at the third highest level in the same period with a crop of 6.884 million mt. Quality data was limited but they implied that initial specific weight were ranging from 65-69 kg/hl although the late July unsettled weather could lead to some of the later crop displaying poorer quality although this is not confirmed at this time.

8 August 2015

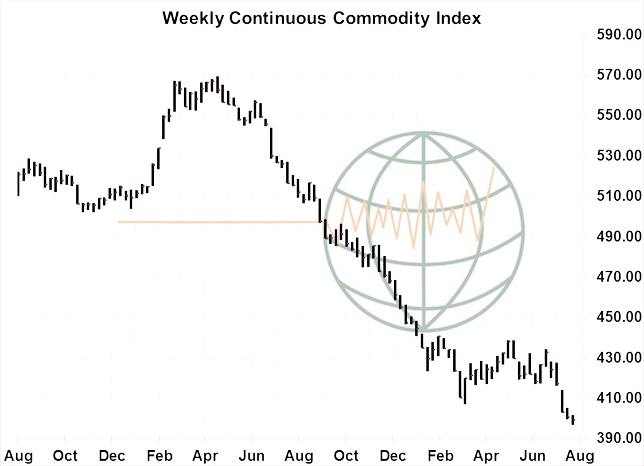
Weekly CCI Analysis:

The CCI/CRB bounced on Friday but settled the week at new multi-year lows. The plunge continues to be driven by weak energy and metal prices, with only limited rallies in ag markets offsetting this. We maintain a longer term bearish outlook as the US$ has not yet peaked. The July US employment report featured the addition of 215,000 new jobs, which was close to expectations but which also validates a rate hike from the Feb sometime in early autumn. The US$ consolidated late in the week, but near rally highs and concern over China and South American economies persists. Crop production, specifically, will likely expand outside of the US amid renewed weakness in currencies in the Black Sea and Brazil, and crude’s decline has not triggered the necessary improvement in consumption.
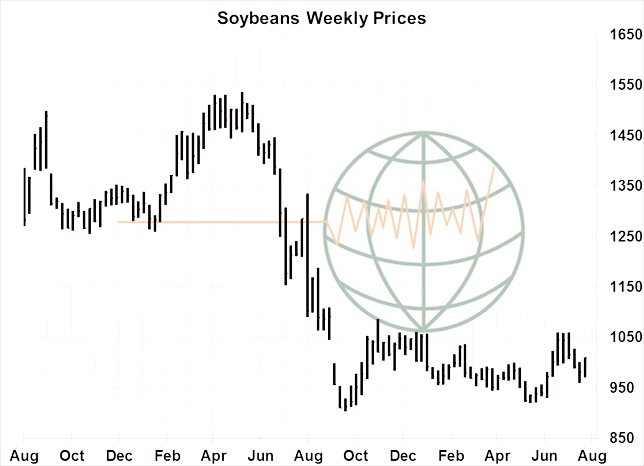
Longer-term soybean analysis:

Soybean futures held in a narrow range for much of the week, but were higher at Friday’s close on short covering ahead of the August crop report, and drier than desired weather forecasts across the Eastern Midwest. New crop export sales were the largest of the year at just over 1 million mt, and there were also announcements of several more cargos sold to China through the week. However, new crop sales remain well behind last year, and indicate that the USDA could be overestimating soybean exports by 150-200 million bu. Market focus in the week ahead will be on the August crop report. Ahead of the report, the average trade estimate calls for a soybean crop of 3.7 billion bu, barely under last year’s record crop. Our view is that once the crop report has passed, market focus will turn towards slow export sales and building US stocks. We continue to remain bearish on any strong rallies ahead of harvest.
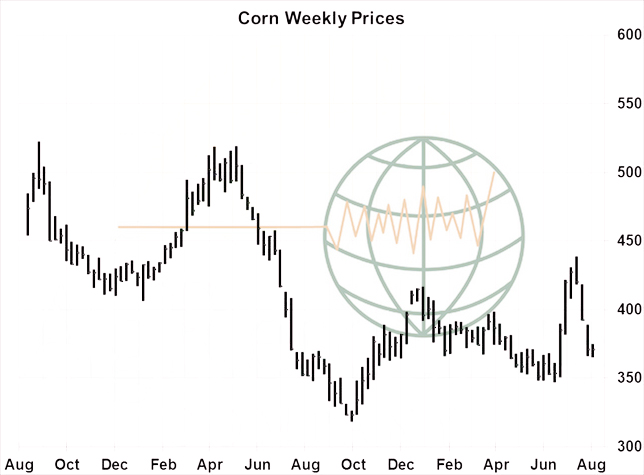
Longer-term corn analysis:

Corn futures this week ended up 3 cents. Critical USDA supply updates lie in the offing, and ahead of next week’s Crop Report, and FSA acreage data the following week, speculative funds have defended what is still a very large net long position. Bullish numbers in the comings weeks are needed to prevent additional long liquidation, but the theme is that US supply (and associated risks) have returned to the forefront of trading strategies. We maintain a longer term bearish outlook amid recent crop condition rating improvements, and as demand shows little sign of improving. S American corn is still offered below US Gulf values into late autumn, and there’s increasing market talk of aggressive Brazilian ethanol exports following a further drop in their currency and very cheap sugar prices. End user demand underpins prices on breaks, but 2015/16 stocks/use forecasts of 14% implies harvest lows of $3.50-3.60, basis December. Supply-driven into early September offer selling opportunities.
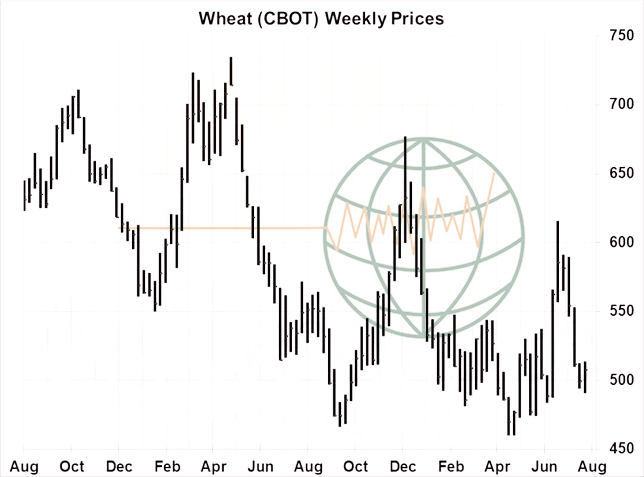
Longer-term wheat analysis:

US wheat futures settled the week mixed, with Dec Chicago up 11, KC up 2 and MGE down 1. HRW’s discount to SRW continues to expand amid burdensome supplies and as Gulf fob prices are some $30-40/mt amid competing origins. This HRW discount will be a feature in spot months in the foreseeable future. Otherwise, there’s little change. Egypt’s latest tender again confirmed that major world exporters are searching hard for demand, and Black Sea and EU cash prices have fallen to seasonal lows. Russian domestic prices are in decline amid winter harvest and favourable spring wheat conditions – and the Ruble posted a new multi-month low this week, which makes Russian wheat that much more competitive. The overreaching theme remains too much supply chasing too little demand, and US end stocks of 925- 950 million bu argue against any sustained rally in the months ahead. Better export and feed consumption is needed. A range of $4.80-5.30, spot, is projected into autumn.
6 August 2015

  • The USDA has today released its weekly export figures as detailed below:

Wheat: 840,800 mt, which is above estimates of 400,000-600,000 mt.
Corn: 274,300 mt, which is below estimates of 350,000-950,000 mt.
Soybeans: 576,900 mt, which is within estimates of 350,000-900,000 mt.
Soybean Meal: 59,900 mt, which is within estimates of 50,000-225,000 mt.
Soybean Oil: 10,200 mt, which is within estimates of 5,000-40,000 mt.

  • Brussels has issued weekly wheat export certificates amounting to  442,598 mt, which brings the season total to 2,097,860 mt. The season to date total is 695,076 mt (49.55%) ahead of last year.
  • The hot and dry conditions in Europe, particularly France (but also Romania), are adversely impacting non-irrigated corn acres as we have previously reported. Analyst ODA (Offre & Demande Agricole) puts the EU crop at 63.9 million mt, below the EU Commission’s latest estimate of 65.5 million mt, and significantly below last year’s 77.8 million mt figure.
  • Some trade estimates have come in as low as 61-62 million mt.
  • Chicago markets have been mixed with soybean and corn lower whilst wheat closed a touch higher on the back of better than expected US export sales. Interestingly it seems there were large net cancellations in old crop soybeans and old crop corn whilst new crop soybean sales hit 1 million mt for the first time this season despite the fact thay we would expect this to be a routine number at this time of year. New crop corn sales at 11 million bu can only be described as disappointing and in a nutshell US 2015/16 export commitments for corn, soybeans, soybean meal and wheat remain substantially behind last year.
  • Crude oil and gasoline futures prices extended their losses down $0.90/barrel and $0.04/gallon respectively with spot ethanol following behind.
  • In Europe, Paris wheat rallied as Socomac followed Senalia in halting grain intake into the Rouen silo (export and futures) quite what the link is is something of a mystery but it is happening and we are not too proud to admit it. Hopefully we will reach some conclusions before long!

5 August 2015

  • Last night saw analyst, FC Stone issue its latest US crop estimates, which showed US corn yield at 165 bushels/acre and soybean yield at 45 bushels/acre. Both numbers were viewed as bearish upon release as they translated into the 3rd largest US corn and 2nd largest US soybean crops on record, and bullish inspiration was difficult to find. However, historically, FC Stone has overstated the US corn yield 59% of the time and in soybeans 64% of the time. Thus, there is a slight bias to overstate yield and production in their estimates compared to the upcoming NASS report.
  • Further detail into the release shows that FC Stone as of August 1st estimated the US corn crop at 13,381 million bu based upon a yield of 165 bushels/acre. This yield is above what the trade was expecting and is considered slightly bearish. Stone pegged the IA corn yield at 187 bushels/acre, IL at 174 and MN at 184 bushels/acre. The IN corn yield was estimated at 149 bushels/acre and OH at 160 bushels/acre. The MO corn yield was estimated at 130 bushels/acre. FC Stone estimated August 1st US soybean yield at 45 bushels/acre with US production at 3,797 million bu. Stone estimated the IL soybean yield at 48 bushels/acre, IA at 52 bushels/acre, and MN at 47 bushels/acre. The IN soybean yield was pegged at 45 bushels/acre with OH at 47 bushels/acre. The Missouri soybean production as estimated at 200 million bu with a yield of 35 bushels/acre. It’s interesting to note that the ND soybean yield at 36 bushels/acre was above MO yield of 35 bushels/acre. The FC Stone soybean yield was seen as slightly bearish and some slight pressure was expected in the overnight trade.
  • Having said that, today has seen additional risk premium being added into corn, wheat and soybean futures ahead of next weeks critical USDA releases including the August crop report and the FSA acreage data due on 17th. Talk of drier than desired conditions across much of the eastern corn belt in the coming week, although heat is absent, has also added some premium today.
  • Informa Economics added to the data party with their latest estimates, which pegged US corn yield at 165.4 bushels/acre and output at 13,412 million bu and soybean yield at 45.4 bushels/acre with output at 3,789 million bu. Both numbers were a touch above trade estimates and again are deemed slightly bearish. Worthy of additional note is their adjustment to Ukrainian corn output, an additional ½ million mt to 26.5 and an additional ½ million mt to Russian wheat output to 57.5 million mt.
  • Egypt’s GASC issued a further wheat tender, this time for 11-20 September shipment, which saw what can only be described as a stunning range of offers with Russian, Ukraine, Romanian and French offers all undercutting recent paper market prices, and that despite the removal of the 13.5% moisture allowance on French. Russia secured 120,000 mt from Russia around $7 below the last tender price despite Ukraine being cheapest on an FOB basis. (Maybe there was a disagreement on the price of cotton in exchange!) Paris wheat on the Matif exchange traded lower initially but, despite Egypt, it reversed when Chicago rallied.